Download
1 / 62
620 likes | 651 Views
Learn about clustering techniques maximizing inter-cluster distances and minimizing intra-cluster distances. Discover applications, similarity measures, types of clusters, clustering algorithms, and more.

E N D
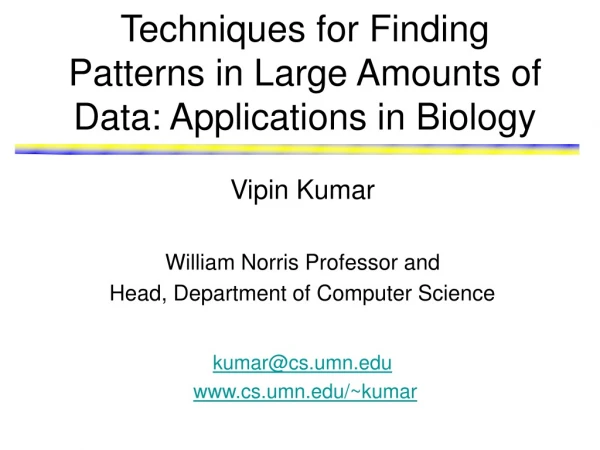
Clustering Techniques for Finding Patterns in Large Amounts of Biological Data Michael Steinbach Department of Computer Science steinbac@cs.umn.eduwww.cs.umn.edu/~kumar
Inter-cluster distances are maximized Intra-cluster distances are minimized Clustering • Finding groups of objects such that the objects in a group will be similar (or related) to one another and different from (or unrelated to) the objects in other groups
Applications of Clustering • Applications: • Gene expression clustering • Clustering of patients based on phenotypic and genotypic factors for efficient disease diagnosis • Market Segmentation • Document Clustering • Finding groups of driver behaviors based upon patterns of automobile motions (normal, drunken, sleepy, rush hour driving, etc) Courtesy: Michael Eisen
How many clusters? Six Clusters Two Clusters Four Clusters Notion of a Cluster can be Ambiguous
Similarity and Dissimilarity Measures • Similarity measure • Numerical measure of how alike two data objects are. • Is higher when objects are more alike. • Often falls in the range [0,1] • Dissimilarity measure • Numerical measure of how different are two data objects • Lower when objects are more alike • Minimum dissimilarity is often 0 • Upper limit varies • Proximity refers to a similarity or dissimilarity
Euclidean Distance • Euclidean Distance Where n is the number of dimensions (attributes) and xk and yk are, respectively, the kth attributes (components) or data objects x and y. • Correlation
Density • Measures the degree to which data objects are close to each other in a specified area • The notion of density is closely related to that of proximity • Concept of density is typically used for clustering and anomaly detection • Examples: • Euclidean density • Euclidean density = number of points per unit volume • Probability density • Estimate what the distribution of the data looks like • Graph-based density • Connectivity
Types of Clusterings • A clustering is a set of clusters • Important distinction between hierarchical and partitionalsets of clusters • Partitional Clustering • A division data objects into non-overlapping subsets (clusters) such that each data object is in exactly one subset • Hierarchical clustering • A set of nested clusters organized as a hierarchical tree
Other Distinctions Between Sets of Clusters • Exclusive versus non-exclusive • In non-exclusive clusterings, points may belong to multiple clusters. • Can represent multiple classes or ‘border’ points • Fuzzy versus non-fuzzy • In fuzzy clustering, a point belongs to every cluster with some weight between 0 and 1 • Weights must sum to 1 • Probabilistic clustering has similar characteristics • Partial versus complete • In some cases, we only want to cluster some of the data • Heterogeneous versus homogeneous • Clusters of widely different sizes, shapes, and densities
Types of Clusters: Well-Separated • Well-Separated Clusters: • A cluster is a set of points such that any point in a cluster is closer (or more similar) to every other point in the cluster than to any point not in the cluster. 3 well-separated clusters
Types of Clusters: Center-Based • Center-based • A cluster is a set of objects such that an object in a cluster is closer (more similar) to the “center” of a cluster, than to the center of any other cluster • The center of a cluster is often a centroid, the average of all the points in the cluster, or a medoid, the most “representative” point of a cluster 4 center-based clusters
Types of Clusters: Contiguity-Based • Contiguous Cluster (Nearest neighbor or Transitive) • A cluster is a set of points such that a point in a cluster is closer (or more similar) to one or more other points in the cluster than to any point not in the cluster. 8 contiguous clusters
Types of Clusters: Density-Based • Density-based • A cluster is a dense region of points, which is separated by low-density regions, from other regions of high density. • Used when the clusters are irregular or intertwined, and when noise and outliers are present. 6 density-based clusters
Clustering Algorithms • K-means and its variants • Hierarchical clustering • Other types of clustering
K-means Clustering • Partitional clustering approach • Number of clusters, K, must be specified • Each cluster is associated with a centroid (center point) • Each point is assigned to the cluster with the closest centroid • The basic algorithm is very simple
K-means Clustering – Details • The centroid is (typically) the mean of the points in the cluster • Initial centroids are often chosen randomly • Clusters produced vary from one run to another • ‘Closeness’ is measured by Euclidean distance, cosine similarity, correlation, etc • Complexity is O( n * K * I * d ) • n = number of points, K = number of clusters, I = number of iterations, d = number of attributes
Evaluating K-means Clusters • Most common measure is Sum of Squared Error (SSE) • For each point, the error is the distance to the nearest cluster • To get SSE, we square these errors and sum them • x is a data point in cluster Ci and mi is the representative point for cluster Ci • Given two sets of clusters, we prefer the one with the smallest error • One easy way to reduce SSE is to increase K, the number of clusters
Two different K-means Clusterings Original Points Optimal Clustering Sub-optimal Clustering
Limitations of K-means • K-means has problems when clusters are of differing • Sizes • Densities • Non-globular shapes • K-means has problems when the data contains outliers.
Limitations of K-means: Differing Sizes K-means (3 Clusters) Original Points
Limitations of K-means: Differing Density K-means (3 Clusters) Original Points
Limitations of K-means: Non-globular Shapes Original Points K-means (2 Clusters)
5 1 3 5 2 1 2 3 6 4 4 Hierarchical Clustering • Produces a set of nested clusters organized as a hierarchical tree • Can be visualized as a dendrogram • A tree like diagram that records the sequences of merges or splits
Strengths of Hierarchical Clustering • Do not have to assume any particular number of clusters • Any desired number of clusters can be obtained by ‘cutting’ the dendrogram at the proper level • They may correspond to meaningful taxonomies • Example in biological sciences (e.g., animal kingdom, phylogeny reconstruction, …)
Hierarchical Clustering • Two main types of hierarchical clustering • Agglomerative: • Start with the points as individual clusters • At each step, merge the closest pair of clusters until only one cluster (or k clusters) left • Divisive: • Start with one, all-inclusive cluster • At each step, split a cluster until each cluster contains a point (or there are k clusters) • Traditional hierarchical algorithms use a similarity or distance matrix • Merge or split one cluster at a time
Agglomerative Clustering Algorithm • More popular hierarchical clustering technique • Basic algorithm is straightforward • Compute the proximity matrix • Let each data point be a cluster • Repeat • Merge the two closest clusters • Update the proximity matrix • Until only a single cluster remains • Key operation is the computation of the proximity of two clusters • Different approaches to defining the distance between clusters distinguish the different algorithms
p1 p2 p3 p4 p5 . . . p1 p2 p3 p4 p5 . . . Starting Situation • Start with clusters of individual points and a proximity matrix Proximity Matrix
C1 C2 C3 C4 C5 C1 C2 C3 C4 C5 Intermediate Situation • After some merging steps, we have some clusters C3 C4 C1 Proximity Matrix C5 C2
C1 C2 C3 C4 C5 C1 C2 C3 C4 C5 Intermediate Situation • We want to merge the two closest clusters (C2 and C5) and update the proximity matrix. C3 C4 Proximity Matrix C1 C5 C2
After Merging • The question is “How do we update the proximity matrix?” C2 U C5 C1 C3 C4 C1 ? ? ? ? ? C2 U C5 C3 C3 ? C4 ? C4 Proximity Matrix C1 C2 U C5
p1 p2 p3 p4 p5 . . . p1 p2 p3 p4 p5 . . . How to Define Inter-Cluster Distance Similarity? • MIN • MAX • Group Average • Distance Between Centroids • Other methods driven by an objective function • Ward’s Method uses squared error Proximity Matrix
p1 p2 p3 p4 p5 . . . p1 p2 p3 p4 p5 . . . How to Define Inter-Cluster Similarity • MIN • MAX • Group Average • Distance Between Centroids • Other methods driven by an objective function • Ward’s Method uses squared error Proximity Matrix
p1 p2 p3 p4 p5 . . . p1 p2 p3 p4 p5 . . . How to Define Inter-Cluster Similarity • MIN • MAX • Group Average • Distance Between Centroids • Other methods driven by an objective function • Ward’s Method uses squared error Proximity Matrix
p1 p2 p3 p4 p5 . . . p1 p2 p3 p4 p5 . . . How to Define Inter-Cluster Similarity • MIN • MAX • Group Average • Distance Between Centroids • Other methods driven by an objective function • Ward’s Method uses squared error Proximity Matrix
p1 p2 p3 p4 p5 . . . p1 p2 p3 p4 p5 . . . How to Define Inter-Cluster Similarity • MIN • MAX • Group Average • Distance Between Centroids • Other methods driven by an objective function • Ward’s Method uses squared error Proximity Matrix
Strength of MIN Original Points Six Clusters • Can handle non-elliptical shapes
Limitations of MIN Two Clusters Original Points • Sensitive to noise and outliers Three Clusters
Strength of MAX Original Points Two Clusters • Less susceptible to noise and outliers
Limitations of MAX Original Points Two Clusters • Tends to break large clusters • Biased towards globular clusters
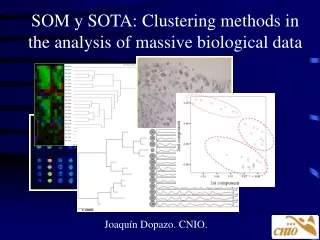
Other Types of Cluster Algorithms • Hundreds of clustering algorithms • Some clustering algorithms • K-means • Hierarchical • Statistically based clustering algorithms • Mixture model based clustering • Fuzzy clustering • Self-organizing Maps (SOM) • Density-based (DBSCAN) • Proper choice of algorithms depends on the type of clusters to be found, the type of data, and the objective
Cluster Validity • For supervised classification we have a variety of measures to evaluate how good our model is • Accuracy, precision, recall • For cluster analysis, the analogous question is how to evaluate the “goodness” of the resulting clusters? • But “clusters are in the eye of the beholder”! • Then why do we want to evaluate them? • To avoid finding patterns in noise • To compare clustering algorithms • To compare two sets of clusters • To compare two clusters
DBSCAN Complete Link K-means Clusters found in Random Data Random Points
Different Aspects of Cluster Validation • Distinguishing whether non-random structure actually exists in the data • Comparing the results of a cluster analysis to externally known results, e.g., to externally given class labels • Evaluating how well the results of a cluster analysis fit the data without reference to external information • Comparing the results of two different sets of cluster analyses to determine which is better • Determining the ‘correct’ number of clusters
Using Similarity Matrix for Cluster Validation • Order the similarity matrix with respect to cluster labels and inspect visually.
Using Similarity Matrix for Cluster Validation • Clusters in random data are not so crisp DBSCAN
Using Similarity Matrix for Cluster Validation • Clusters in random data are not so crisp K-means
Using Similarity Matrix for Cluster Validation • Clusters in random data are not so crisp Complete Link
Measures of Cluster Validity • Numerical measures that are applied to judge various aspects of cluster validity, are classified into the following three types of indices. • External Index: Used to measure the extent to which cluster labels match externally supplied class labels. • Entropy • Internal Index: Used to measure the goodness of a clustering structure without respect to external information. • Sum of Squared Error (SSE) • Relative Index: Used to compare two different clusterings or clusters. • Often an external or internal index is used for this function, e.g., SSE or entropy