Download
1 / 13
130 likes | 251 Views
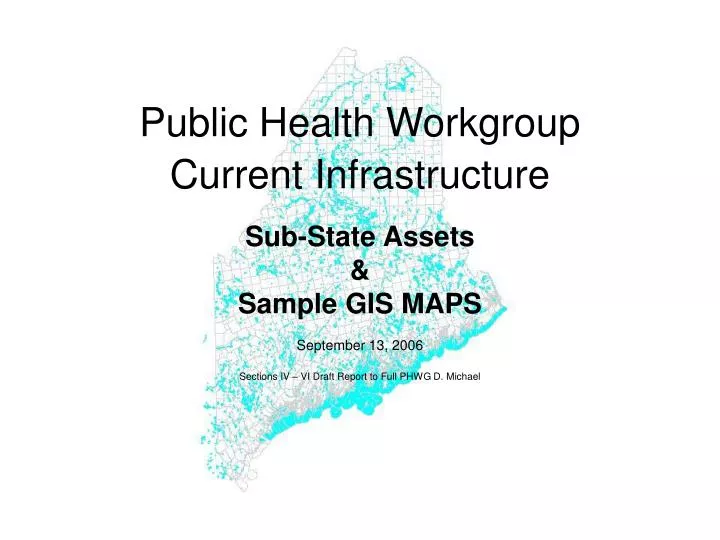
Public Health Workgroup Current Infrastructure. Sub-State Assets & Sample GIS MAPS September 13, 2006 Sections IV – VI Draft Report to Full PHWG D. Michael. Sub-State Assets View. Reflects what we have today Ground-up view of EPHS delivery Begins with people & populations

E N D
Public Health WorkgroupCurrent Infrastructure Sub-State Assets & Sample GIS MAPS September 13, 2006 Sections IV – VI Draft Report to Full PHWG D. Michael
Sub-State Assets View • Reflects what we have today • Ground-up view of EPHS delivery • Begins with people & populations • “types of sub-state organized entities reasonably active in delivery of one or more EPHS”
Caveats… • Criteria for selection – broad & inclusive • Lists presented are likely incomplete • Acknowledge variability in both quality & quantity of services delivered (beyond our scope)
Sub-State Assets • Pgs 12-15: Section IV-B “…Assets ordered by 10 EPHS” • Pg 11: Section IV-A “…Assets - Short List” • Pg 16: Section V – “Map Elements”
Why GIS Maps? • Address sub-committee charge: “What is the current inventory, baseline and Map of services?” • Establish a common visual framework for understanding current infrastructure • Consider usefulness in planning future infrastructure
GIS Maps • Mapping tool is under construction • Potential to “layer on demand” • Individual maps contain selected map elements, which represent some, not all sub-state assets • First viewing of maps by Infrastructure Committee
Dot Density = 100 people • Service Centers are Maine’s Population and Economic Clusters • Service Centers have higher population densities • Maine’s 76 Service Centers are defined by the State Planning Office • Employment (Jobs/Workers) • Volume of Retail Sales • Federally Assisted Housing • Service Sector Employment
White coded census block areas exceed 20% of population in Poverty • Poverty in Maine is more concentrated in: • North and North-east • Inner City Blocks • Inset view (Portland) shows more detailed information, linked to data sets
Maine’s Emergency Management Network includes: • Fire • Police (not shown) • Ambulance/Rescue • Red Cross • County Emergency Agencies • Regional Resource Centers (not shown) • Hospitals (not shown) • And others • Inset view (Bangor) details location of first stations, hospitals etc • Emergency Response • Well developed at the local level • Strong commitment from community volunteers
Hospitals (red cross) • Hospital Service Areas (in color) • Town layer (white boundaries • Hospitals typically located in Services Centers • Hospitals built near population centers • Now help to define the service center as major employers
Maine’s Educational Infrastructure • Population based • Extensive coverage • Strong local commitment • Early Childhood Agencies • 14 Agencies Operating Head Start Programs • 8 Resource Development Centers • Head Start Programs (not shown)
Three coalition types mapped: • Communities for Children and Youth • Healthy Community Coalitions • Healthy Maine Partnerships • Population density (dot density) layer • Some share office space or staff • Coalitions are based primarily in or near to service centers/population centers • Strong commitment from community volunteers
Section Summary Sub-State Assets & GIS Maps Why is this perspective important to the overall understanding of Maine’s Public Health Infrastructure? • Reflects what we HAVE NOW operating ‘on the ground’ • Demonstrates how services relate to PEOPLE & POPULATIONS • Provides a common VISUAL FRAMEWORK or ‘mental map’