Motivation
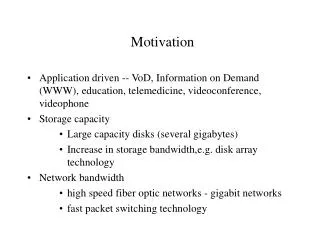
Motivation BioUML platform is the powerful tool for modeling of biological systems and their analysis. However optimization tools have been missed so far. Goals Multi-experiments fitting: Several files with experimental datasets Different initial states of the biological system

Motivation
E N D
Presentation Transcript
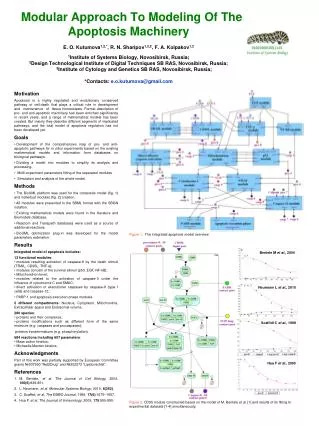
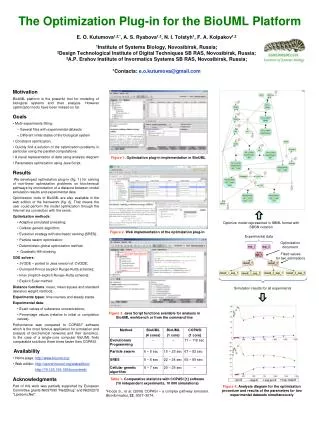
Motivation • BioUML platform is the powerful tool for modeling of biological systems and their analysis. However optimization tools have been missed so far. • Goals • Multi-experiments fitting: • Several files with experimental datasets • Different initial states of the biological system • Constraint optimization. • Quickly find a solution of the optimization problems in particular using the parallel computations. • A visual representation of data using analysis diagram • Parameters optimization using Java Script. • Results • We developed optimization plug-in (fig. 1) for solving of non-linear optimization problems on biochemical pathways by minimization of a distance between model simulation results and experimental data. • Optimization tools of BioUML are also available in the web edition of the framework (fig. 2). That means the user could perform the model optimization through the Internet via connection with the serve. • Optimization methods: • Adaptive simulated annealing; • Cellular genetic algorithm; • Evolution strategy with stochastic ranking (SRES); • Particle swarm optimization; • Deterministic global optimization method; • Quadratic Hill-climbing. • ODE solvers: • JVODE – ported to Java version of CVODE; • Dormand-Prince (explicit Runge-Kutta scheme); • Imex (implicit–explicit Runge–Kutta scheme); • Explicit Euler method. • Distance functions: mean, mean square and standard deviation weight methods. • Experiments types: time courses and steady states. • Experimental data: • Exact values of substance concentrations; • Percentage values (relative to initial or completion values). • Performance was compared to COPASI* software which is the most famous applicationforsimulationandanalysisofbiochemicalnetworksandtheirdynamics. In the case of a single-core computer BioUML finds comparable solutions three times faster then COPASI. • Availability • Home page: http://www.biouml.org/ • Web edition: http://server.biouml.org/webedition/ • http://79.125.109.165/bioumlweb/ • Acknowledgments • Part of this work was partially supported by European Committee grants №037590 “Net2Drug” and №202272 “LipidomicNet”. The Optimization Plug-in for the BioUML PlatformE. O. Kutumova1,2,*, A. S. Ryabova1,3, N. I. Tolstyh1, F. A. Kolpakov1,21Institute of Systems Biology, Novosibirsk, Russia; 2Design Technological Institute of Digital Techniques SB RAS, Novosibirsk, Russia;3A.P. Ershov Institute of Invormatics Systems SB RAS, Novosibirsk, Russia;*Contacts: e.o.kutumova@gmail.com Figure 1. Optimization plug-in implementation in BioUML Optimize model represented in SBML format with SBGN notation Figure 2. Web implementation of theoptimization plug-in Experimental data Optimization document Fitted values for two estimations Simulation results for all experiments Figure 3.Java Script functions available for analysis in BioUML workbench or from the command line Table 1.Comparativestatistics with COPASI [1] software (10 independent experiments, 10 000 simulations) *Hoops S., et al. (2006) COPASI – a complex pathway simulator. Bioinformatics, 22, 3067–3074. Figure 4.Analysis diagram for the optimization procedure and results of the parameters for two experimental datasets simultaneously