Download
1 / 27
290 likes | 377 Views
Diagram Notations. http://www.flickr.com/photos/cardoso/2197507288/. Did you plan to build the Enterprise all on your own????. Diagrams are often useful when… You need to communicate, visualize, or analyze something And that something has some sort of structure.

E N D
Diagram Notations http://www.flickr.com/photos/cardoso/2197507288/
Did you plan to build the Enterpriseall on your own???? • Diagrams are often useful when… • You need to communicate, visualize, or analyze something • And that something has some sort of structure
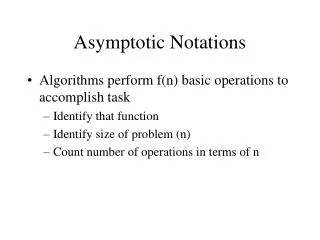
Typical parts of requirements documentation • Functional requirements • Unstructured text • Use cases • Non-functional requirements • Unstructured text • Fit criteria • Diagrams • Class diagrams and entity-relationship diagrams • Dataflow, sequence, and state diagrams
Use case diagram: showsactivities supported by the system Repressed citizen UC#1: Report repression UC#3b: View as RSS feed UC#3a: View on map UC#3: View reports UC#2: Clarify tweet Concerned public
Notes on use case diagrams • Stick man for user • Ovals for use cases • Italicize “abstract” use cases • Simple arrows when a UC “calls” another • Hollow arrowheads for specialization • Similar to the role that subclassing plays in OO
UML class diagram: showsentities, attributes, relationships Clarification tweet + report + when (datetime) + text (string) User + Twitter username Repression report + source (tweet) + location (geocode) + when (datetime) + details (string) * * 0..1 1 * * Repression tweet + user + when (datetime) + text (string) 1 Repression view + reports * Google map view + JavaScript RSS View + XML text System boundary
Notes on UML class diagrams • One box per kind of entity, listing attributes • Italicize abstract entities, attributes • Lines without arrowheads show references • Similar to member variables in OO • Labeled with cardinality (multiplicity) • Integers, ranges, or asterisk (for unlimited) • Lines with hollow arrowheads for specialization • Lines with regular arrowheads can be used to indicate dependencies • Usually omitted in requirements’ class diagrams
Entity-relationship diagram: showsentities, attributes, relationships r Clarification tweet report when (datetime) text (string) 0..1 User Twitter username Repression report source (tweet) location (geocode) when (datetime) details (string) p 1 yields s asks about writes shows n 1 q Repression view reports Repression tweet user when (datetime) text (string) Google map view JavaScript RSS View XML text
Notes on entity-relationship diagrams (ERDs) • One box per kind of entity • List entities on branches • Lines with a diamond show relationships • Diamond label indicates role of relationship • Numbers or variables on lines show cardinality
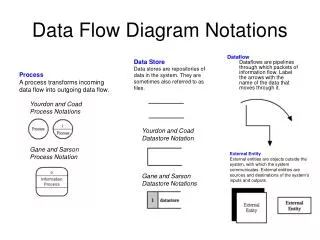
Dataflow diagram: showsflow of information Repressioninfo Report Tweet Reporter Twitter DB Reports DB Tweet Clarificationmessage Send clarreq Clarificationmessage Tweet Inter-pret Clarify Rawreport Location Viewing user Geocoder Map RSS feed Geocode Report RSS View Reports Reports Map View
Notes on dataflow diagrams • Each oval is a “function” provided by system. • Each inward arrow is a parameter (labeled) • Each outward arrow is an output (labeled) • Each rectangle is an actor • A person, place, or thing that can do stuff and/or initiate events • Each “half-rectangle” is a data store (file or database) • Often clearer if you do a separate dataflow diagram for each use case
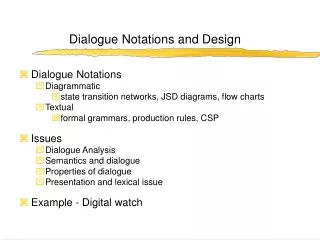
Message sequence diagram: showsflow of control User Twitter System Database Geocoder [geocode != null] Tweet event Read tweets Geocode Create report[if geocode != null] Request to clarify[if geocode == null] Deliver request
Notes on message sequence diagrams • One box per entity involved • E.g.: if you have two users interacting with each other, then you would have two boxes • Each box has a dashed line, showing its “lifetime”, which can end if an object is destroyed • Arrows show messages • Also, draw an dashed arrow back if there’s a return value • Conditionals are written with brackets [ ] • Loops can be enclosed in a shaded box
State chart: showschange over time Report status Raw tweet(just text) Geocoded(geocode != null) record geocoding fails & user retweets In database(geocode == null) geocodingsucceeds
Notes on state charts • One box per state • Arrows show a possible state transition • Annotated to indicate under what conditions the transition occurs • Filled circle shows where you “start” • Nested filled circle shows where you “stop”
Putting it together: a typical requirements document • Requirements definition • Unstructured text: functional & non-functional reqs • Use case descriptions • Class diagrams or ERDs showing external entities • Requirements specification • Unstructured text: functional & non-functional reqs • Dataflow diagram • Message sequence diagrams or state charts
An example system to support drug and alcohol counseling http://cf.polarishealth.com/demo/start_demo.html
Requirements definition,functional reqs, unstructured text • Before each counseling visit, each counselee takes a survey. • After each survey, the system prints a report showing the counselee’s progress. • Administrative assistants can add counselees and their counselors to the system. Requirements definition: written from external viewpoint; system is like a “black box”
Requirements definition,non-functional reqs, with fit criteria • Each survey will be short enough for an average user to complete within 10 minutes. • Progress reports will each be 2 pages or less. • The system will print progress reports within 2 minutes of a survey’s completion. • Users can take a survey using a Windows machine that has a Pentium II 550 MHz CPU, with 0.5 GB of RAM. Requirements definition: written from external viewpoint; system is like a “black box”
UC#1: Survey and report • Actor: Counselee • Precondition: Counselee registered in system • Postconditions: • Counselee progress data is recorded in system • Report is printed for use by counselor • Flow of events: • Counselee logs in (lastname + PIN) • System collects survey data from counselee • System prints report
Class diagram of entities User + lastname (string) + PIN (int) Report + surveys + counselor * 1 Counselor + reports * * 1 Survey + questions (String []) + answers (int []) + counselee * Counselee + counselor + surveys * 1 System boundary
Requirements specification, functional reqs, unstructured text • Survey data will be stored in the database at the end of the survey, and a report will be sent to the printer. • The system will provide screens for adding, editing, and deactivating counselee and counselor records from a database. Requirements specification: written from system’s viewpoint, involving internal details of system
Requirements specification,non-functional reqs, with fit criteria • 95% of the code will be platform-independent (Java or platform-independent JavaScript). • The system will record completed surveys in the database within 30 seconds; reports will be sent to the printer within 30 seconds and emerge within 60 seconds. Requirements specification: written from system’s viewpoint, involving internal details of system
Dataflow diagram(note: only shows UC#1) Authenticate Last name & PIN Counselee Printer Survey DB User ID Surveyanswers HealthInformation Survey All thispatient’sanswers (ever) Pick up Create report Printout Postscript Printout Counselor
Message sequence diagramUC#1 Counselee Server Database Printer Log in [survey complete] Present question Answer question Record answers Get report data Send report to printer
A few general comments • These are just the basic diagrams. • Sufficient for our homework, exams, and probably 90% of what you’ll see after graduation • Fancier versions of these diagrams do exist • It’s OK to draw diagrams by hand • As long as you respect the notation • And, at least for homework, scan it into a PDF
What’s next for you? • Finish your HW1 by Monday, before midnight • Email me if you have questions • Every team member should be contributing • Remember: Try to resolve any disputes on your own first