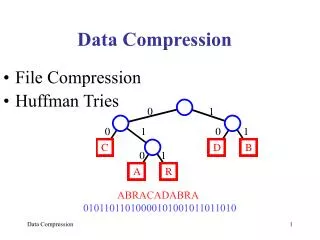
Advancements in Model-Based Semantic Compression for Network Data Management
This paper explores model-based semantic compression methods for optimizing the storage and transmission of extensive network data tables. Given the vast volume of relational data generated by networks, effective compression is vital for efficient analysis and capacity planning. We present SPARTAN, a system utilizing classification and regression trees to capture data dependencies and enhance compression ratios. By allowing for flexible trade-offs between lossless and lossy compression, SPARTAN ensures the management of enormous datasets is both efficient and user-driven.

Advancements in Model-Based Semantic Compression for Network Data Management
E N D
Presentation Transcript
Model-Based Semantic Compression for Network-Data Tables Shivnath Babu Stanford University with Minos Garofalakis, Rajeev Rastogi, Avi Silberschatz Bell Laboratories NRDM, Santa Barbara, CA, May 25, 2001
Introduction • Networks create massive, fast-growing relational-data tables • Switch/router-level network performance data • SNMP and RMON data • Packet and flow traces (Sprint IP backbone -- 600 gigabytes/day) • Call Detail Records (AT&T -- 300 million records/day) • Web-server logs (Akamai -- 10-100 billion log-lines/day) • The data is important for running big enterprises effectively • Application and user profiling • Capacity planning and provisioning, determining pricing plans • The data needs to be stored, analyzed, and (often) shipped across sites
Protocol DurationBytes Packets http 12 20K 3 http 16 24K 5 http 15 20K 8 http 19 40K 11 http 26 58K 18 ftp 27 100K 24 ftp 32 300K 35 ftp 18 80K 15 Compressing Massive Tables • Example table: network flow measurements (simplified) • Good compression is essential • Optimizes storage, I/O, network bandwidth over the lifetime of the data • Can afford “intelligent” compression
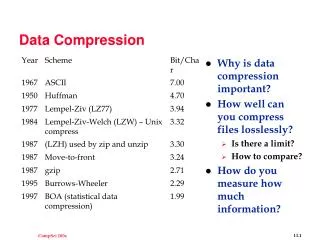
Compressing Massive Tables: A New Direction in Data Compression • Several generic compression techniques and tools (e.g., Huffman, • Lempel-Ziv, Gzip) • Syntactic: operate at byte-level, view table as a large byte-string • Lossless: do not support lossless and lossy compression • Semantic compression • Exploiting data characteristics and dependencies improves compression ratio significantly • Capturing aggregate data characteristics ties in with enterprise data monitoring and analysis • Benefits of lossy compression schemes • Enables trading precision for performance (compression time and storage) • Tradeoff can be adjusted by user(flexible)
SPARTAN: A Model-Based Semantic Compressor • New compression paradigm: Model-Based Semantic Compression (MBSC) • Extract data mining models from table • Derive compression plan using the extracted models • Use models to represent data succinctly • Use models to drive other model building • Compress different data partitions using different models • Lossless and lossy compression (within user-specified error bounds) • SPARTAN system implements a specific instantiation of MBSC • Key idea: Classification and Regression Trees (CaRTs) can capture cross-column dependencies and eliminate entire data columns
Packets > 10 yes no error = 0 Bytes > 60K yes no Protocol = http Protocol = ftp Protocol = http Packets > 16 error <= 3 yes no Duration = 29 Duration = 15 SPARTAN: Semantic Compression with Classification and Regression Trees (CaRTs) error=0 error<=3 A compact CaRT can eliminate an entire column by prediction Outlier: Packets=11, Duration = 19
SPARTAN Compression Problem Formulation • Given:Data table over set of attributes X and per-attribute error tolerances • Find:Set of attributes P to be predicted using CaRTs such that: • Overall storage cost (CaRTs + outliers + materialized columns) is minimized • Each attribute in P is predicted within its specified tolerance • A predicted attribute should not be used to predict another attribute -- otherwise errors will compound • Non-trivial problem • Space of possible CaRT predictors is exponential in number of attributes
Two Phase Compression • Planning Phase -- Come up with a compression plan • Compression Phase -- Scan the data and compress it using the plan
[e1,e2,e3,e4] Error tolerance vector DependencyFinder X1 X2 X3 X4 Random sample of input table Semantic-compression Plan SPARTAN Architecture: Planning Phase
Education Profession Employer Income SPARTAN’s DependencyFinder • Goal: Identify strong dependencies among attributes to prune the • (huge) search space of possible CaRT models • Input: Random sample of input table T • Output: A Bayesian Network (BN) over T’s attributes • Structure of BN: Neighbors are the “strongly” related attributes
X1 X2 [e1,e2,e3,e4] Error tolerance vector X3 DependencyFinder CartSelector X4 X1 X2 X3 X4 Random sample of input table Semantic-compression Plan SPARTAN Architecture: Planning Phase
SPARTAN’s CaRTSelector • Heart of SPARTAN’s semantic-compression engine • Output: Subset of attributes P to be predicted (within tolerance) • and corresponding CaRTs • Uses Bayesian Network constructed by DependencyFinder • Hard optimization problem: strict generalization of Weighted Maximum Independent Set (WMIS) (NP-hard) • Two solutions: • Greedy heuristic • New heuristic based on WMIS approximation algorithms
Maximum Independent Set (MIS) CaRTSelector • Exploits mapping of WMIS to CaRTSelector problem • Hill-climbing search that proceeds in iterations • Start with set of predicted attributes (P) empty; all attributes materialized (M) • Each iteration improves earlier solution by moving a selected subset of nodes from M to P • Map to a WMIS instance and use solution • “Weight” of a node (attribute) = materializationCost – predictionCost • Stop when no improvement is possible • Number of CaRTs built (n = #attributes) • Greedy CaRTSelector: O(n) • MIS CaRTSelector : O(n^2) in the worst case, O(n logn) “on average”
X1 X2 [e1,e2,e3,e4] Error tolerance vector X3 DependencyFinder CartSelector X4 X1 X2 X3 X4 Random sample of input table BuildCaRT [{X1,X2}->X3,e3] X1 X2 X3 X4 M P X2 > 16 Semantic-compression Plan yes no RowAggregator CartBuilder Outlier: X2=11, X3=19 X3=29 X3=15 SPARTAN Architecture: Planning Phase
Experimental Results: Summary • SPARTAN system has been tested over several real data sets • Full details are in – S. Babu, M. Garofalakis, R. Rastogi. SPARTAN: A Model-Based Semantic Compression System for Massive Data Tables. SIGMOD 2001 • Better compression ratios compared toGzip and Fascicles • factors up to 3 (for 5-10% error tolerances for numeric attributes) • 20-30% on average for 1% error for numeric attributes • Small sample sizes are effective for model-based compression • 50KB is often sufficient
Conclusions • MBSC: A novel approach to massive-table compression • SPARTAN: a specific instantiation of MBSC • Uses CaRTs to eliminate significant fractions of columns by prediction • Uses a Bayesian Network to identify predictive correlations and drive the selection of CaRTs • CaRT-selection problem is NP-hard • Two heuristic-search-based algorithms for CaRT-selection • Experimental evidence for effectiveness of SPARTAN’s model-based approach
Future Direction in MBSC: Compressing Continuous Data Streams • Networks generate continuous streams of data • E.g., packet traces, flow traces, SNMP data • Applying MBSC to continuous data streams • Data characteristics and dependencies can vary over time • Goal: compression plan should adapt to changes in data characteristics • Models must be maintained online as tuples arrive in the stream • Study data mining models with respect to online maintanence • Incremental • Data stream speeds • Parallelism • Trade precision for performance • Eager Vs. Lazy schemes • Compression plan must be maintained with respect to models
Future Direction in MBSC: Distributed MBSC • Data collection infrastructure is often distributed • Multiple monitoring points over an ISP’s network • Web servers are replicated for load balancing and reliability • Data must be compressed before being transferred to warehouses or repositories • MBSC can be done locally at each collection point • Lack of “global” data view might result in suboptimal compression plans • More sophisticated approaches might be beneficial • Distributed data mining problem • Opportunity cost of network bandwidth is high -- keep communication overhead minimal
Root-cause analysis Anomaly detection Compression Data mining models Network data Future Direction in MBSC: Using Extracted Models in other Contexts • A crucial side-effect of MBSC -- capturing data characteristics helps enterprise data monitoring and analysis • Interaction models (e.g., Bayesian Network) enable event-correlation and root-cause analysis for network management • Anomaly detection -- intrusions, (distributed) denial-of-service attacks