Download
1 / 15
150 likes | 262 Views
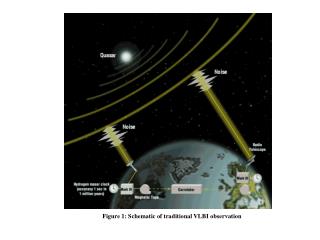
Explore how Very Long Baseline Interferometry (VLBI) achieves unprecedented image resolution in radio astronomy across vast distances. See examples and network setups.

E N D
Figure 2: Example illustrating how VLBI can produce ultra-high resolution images of the core of a radio source. This example show how VLBI can zoom into the very core of the giant radio galaxy NGC6251, at a distance of ~100 megaparsecs from Earth; the lower zoomed image is a VLBI image of the core where 1 parsec corresponds to ~2 milliarcseconds (1 parsec=3.26 light years).
Figure 3: Plot of the VLBI-measured distance between the Westford antenna in Westford, MA and an antenna in Wettzell, Germany over a period of ~10 years; the measured change rate of 17 mm/yr corresponds closely to the actual Atlantic seafloor spreading rate!
Glownet, Bossnet, MAX, NASA/HECN network segments Figure 5: Schematic of Gbps e-VLBI demonstration experiment
Figure 14: Traffic analysis of sustained tests (from Extreme 5i switch in data path)