1 / 1

Taiwan's Average Annual Precipitation Distribution 1949-2009

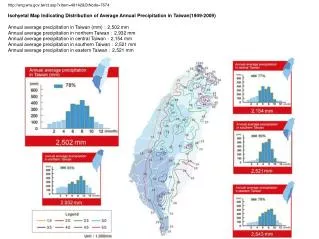
Explore isohyetal map indicating average annual precipitation in Taiwan from 1949-2009. View regional averages and detailed breakdown for northern, central, southern, and eastern Taiwan.

Download Presentation

Taiwan's Average Annual Precipitation Distribution 1949-2009

An Image/Link below is provided (as is) to download presentation Download Policy: Content on the Website is provided to you AS IS for your information and personal use and may not be sold / licensed / shared on other websites without getting consent from its author. Content is provided to you AS IS for your information and personal use only. Download presentation by click this link. While downloading, if for some reason you are not able to download a presentation, the publisher may have deleted the file from their server. During download, if you can't get a presentation, the file might be deleted by the publisher.

E N D

Presentation Transcript


  1. http://eng.wra.gov.tw/ct.asp?xItem=48142&CtNode=7674 Isohyetal Map Indicating Distribution of Average Annual Precipitation in Taiwan(1949-2009) Annual average precipitation in Taiwan (mm):2,502 mmAnnual average precipitation in northern Taiwan:2,932 mmAnnual average precipitation in central Taiwan:2,154 mmAnnual average precipitation in southern Taiwan:2,521 mmAnnual average precipitation in eastern Taiwan:2,521 mm

More Related