Macroeconomic Analysis: Money, Interest Rates, and Output
290 likes | 309 Views
This chapter outlines the links between the goods and money markets, the impact of investment and interest rates on output, policy effects like expansionary and contractionary measures, and other factors influencing planned investments. It also explains the IS-LM Diagram and the equilibrium dynamics between money supply and demand in an economy.

Macroeconomic Analysis: Money, Interest Rates, and Output
E N D
Presentation Transcript
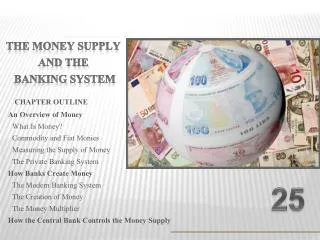
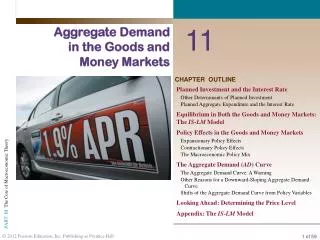
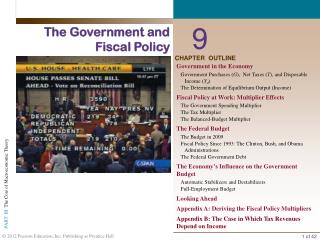
PART IV MACROECONOMIC ANALYSIS 25 Money, the InterestRate, and Output:Analysis and Policy Chapter Outline The Links Between the Goods Market and the Money MarketInvestment, the Interest Rate, and the Goods MarketMoney Demand, Aggregate Output (Income), and the Money MarketCombining the Goods Market and the Money MarketExpansionary Policy EffectsContractionary Policy EffectsThe Macroeconomic Policy MixOther Determinants of Planned InvestmentLooking Ahead: The Price LevelAppendix: The IS-LM Diagram
MONEY, THE INTEREST RATE, AND OUTPUT:ANALYSIS AND POLICY goods market The market in which goods and services are exchanged and in which the equilibrium level of aggregate output is determined. money market The market in which financial instruments are exchanged and in which the equilibrium level of the interest rate is determined.
THE LINKS BETWEEN THE GOODS MARKETAND THE MONEY MARKET There are two key links between the goods market and the money market: ■ Link 1: Income and the Demand for Money Income, which is determined in the goods market, has considerable influence on the demand for money in the money market. ■ Link 2: Planned Investment Spending and the Interest Rate The interest rate, which is determined in the money market, has significant effects on planned investment in the goods market.
THE LINKS BETWEEN THE GOODS MARKETAND THE MONEY MARKET FIGURE 12.1 Links Between the Goods Market and the Money Market
DETERMINANTS OF PLANNED INVESTMENT The determinants of planned investment are ■ The interest rate ■ Expectations of future sales ■ Capital utilization rates ■ Relative capital and labor costs Those regarding the reward to the investment can be summarized by the rate of return.
THE LINKS BETWEEN THE GOODS MARKETAND THE MONEY MARKET INVESTMENT, THE INTEREST RATE, AND THE GOODS MARKET Several investment projects available in the economy: A: $200 million with annual rate of return 20% B: $400 million with annual rate of return 15% C: $300 million with annual rate of return 10% D: $500 million with annual rate of return 5% When the interest rate is 12%, both A and B are good investment, while C and D are not. Planned investment is $600 million When the interest rate is 6%, A ,B and C are good investment, while D is not. Planned investment is $900 million
THE LINKS BETWEEN THE GOODS MARKETAND THE MONEY MARKET INVESTMENT, THE INTEREST RATE, AND THE GOODS MARKET When the interest rate falls, planned investment rises. When the interest rate rises, planned investment falls. FIGURE 12.2 Planned Investment Schedule
THE LINKS BETWEEN THE GOODS MARKETAND THE MONEY MARKET The effects of a change in the interest rate include: ■ High interest rate (r) discourages planned investment (I). ■ Planned investment is a part of planned aggregate expenditure (AE). ■ Thus, when the interest rate rises, planned aggregate expenditure (AE) at every level of income falls. ■ Finally, a decrease in planned aggregate expenditure lowers equilibrium output (income) (Y) by a multiple of the initial decrease in planned investment. Using a convenient shorthand:
THE LINKS BETWEEN THE GOODS MARKETAND THE MONEY MARKET FIGURE 12.3 The Effect of an Interest Rate Increase on Planned Aggregate Expenditure
THE LINKS BETWEEN THE GOODS MARKETAND THE MONEY MARKET MONEY DEMAND, AGGREGATE OUTPUT (INCOME), AND THE MONEY MARKET FIGURE 12.4 Equilibrium in the Money Market
THE LINKS BETWEEN THE GOODS MARKETAND THE MONEY MARKET FIGURE 12.5 The Effect of an Increase in Income (Y) on the Interest Rate (r)
THE LINKS BETWEEN THE GOODS MARKETAND THE MONEY MARKET The equilibrium level of the interest rate is not determined exclusively in the money market. Changes in aggregate output (income) (Y), which take place in the goods market, shift the money demand curve and cause changes in the interest rate. With a given quantity of money supplied, higher levels of Y will lead to higher equilibrium levels of r. Lower levels of Y will lead to lower equilibrium levels of r, as represented in the following symbols:
COMBINING THE GOODS MARKETAND THE MONEY MARKET EXPANSIONARY POLICY EFFECTS expansionary fiscal policy An increase in government spending or a reduction in net taxes aimed at increasing aggregate output (income) (Y). expansionary monetary policy An increase in the money supply aimed at increasing aggregate output (income) (Y).
COMBINING THE GOODS MARKETAND THE MONEY MARKET FIGURE 12.6 The Crowding-Out Effect
COMBINING THE GOODS MARKETAND THE MONEY MARKET Expansionary Fiscal Policy: An Increase in Government Purchases (G) or a Decrease in Net Taxes (T) crowding-out effect The tendency for increases in government spending to cause reductions in private investment spending.
COMBINING THE GOODS MARKETAND THE MONEY MARKET Effects of an expansionary fiscal policy: interest sensitivity or insensitivity of planned investment The responsiveness of planned investment spending to changes in the interest rate. Interest sensitivity means that planned investment spending changes a great deal in response to changes in the interest rate; interest insensitivity means little or no change in planned investment as a result of changes in the interest rate.
COMBINING THE GOODS MARKETAND THE MONEY MARKET Effects of an expansionary monetary policy: Expansionary Monetary Policy: An Increase in the Money Supply
COMBINING THE GOODS MARKETAND THE MONEY MARKET Effects of a contractionary fiscal policy: CONTRACTIONARY POLICY EFFECTS Contractionary Fiscal Policy: A Decrease in Government Spending (G) or an Increase in Net Taxes (T) contractionary fiscal policy A decrease in government spending or an increase in net taxes aimed at decreasing aggregate output (income) (Y).
COMBINING THE GOODS MARKETAND THE MONEY MARKET Effects of a contractionary monetary policy: Contractionary Monetary Policy: A Decrease in the Money Supply contractionary monetary policy A decrease in the money supply aimed at decreasing aggregate output (income) (Y).
COMBINING THE GOODS MARKETAND THE MONEY MARKET THE MACROECONOMIC POLICY MIX policy mix The combination of monetary and fiscal policies in use at a given time.
COMBINING THE GOODS MARKETAND THE MONEY MARKET Expansionary Policy in Action: The Recessions of 1974–1975, 1980–1982, 1990–1991, and 2001 FIGURE 12.7 Fed Accommodation of an Expansionary Fiscal Policy
Appendix A THE IS-LM DIAGRAM • AnIS curve illustrates the negative relationship between the equilibrium value of aggregate output (income) (Y) and the interest rate in the goods market. As interest goes down, planned investment goes up, and so does the equilibrium Y in goods market. THE IS CURVE FIGURE 12A.1 The IS Curve
Appendix A THE IS-LM DIAGRAM • Expansionary (contractionary) fiscal policy causes a rightward (leftward) shift of the IS curve. THE IS CURVE At any given interest rate, expansionary (contractionary) fiscal policy causes an increase (decrease) in AE so it results in a higher (lower) equilibrium Y in goods market. The whole IS curve moves to its right (left). FIGURE 12A.1 The IS Curve
Appendix A THE LM CURVE • An LM curve illustrates the positive relationship between the equilibrium value of the interest rate and aggregate output (income) (Y) in the money market. As Y goes up, the demand for money increases, and the equilibrium r goes up in money market. FIGURE 12A.2 The LM Curve
Appendix A THE LM CURVE • Expansionary (contractionary) monetary policy causes a rightward (leftward) shift of the LM curve. At any given Y, expansionary (contractionary) monetary policy causes an increase (decrease) in Ms so it results in a lower (higher) equilibrium r in money market. The whole LM curve thus moves to its right (left). FIGURE 12A.2 The LM Curve
Appendix A THE IS-LM DIAGRAM • The IS-LM diagramis a way of depicting graphically the determination of aggregate output (income) and the interest rate in the goods and money markets. FIGURE 12A.3 The IS-LM Diagram
Appendix A FIGURE 12A.4 An Increase in Government Purchases (G)
Appendix A FIGURE 12A.5 An Increase in the Money Supply (Ms)