Download

1 / 15
150 likes | 324 Views
Protein Lysate Microarrays. Clay Scott Ryan McConnell Shannon Neeley. Biological and Technical Background. Motivation. DNA/RNA microarrays are used to determine gene expression Proteomic profiling can help yield more direct answers to biological questions

E N D
Protein Lysate Microarrays Clay Scott Ryan McConnell Shannon Neeley
Motivation • DNA/RNA microarrays are used to determine gene expression • Proteomic profiling can help yield more direct answers to biological questions • Those molecules that can answer our questions are proteins, not mRNA • Biological effector molecules • Diagnostic markers • Pharmaceutical targets
History of Proteomic Profiling • 2D-PAGE (two-dimensional polyacrylamide gel electrophoresis) • Introduced in 1975 • Semiquantitation of most abundant 1000 spots • Problems with identifying spots with a particular protein • Microarray formats for proteomic profiling • More recent development (papers published in 2001) • Robotic spotting of antibodies that capture the protein molecule to be assessed
Reverse-phase protein lysate microarrays • Opposite configuration from previous microarray • Samples assessed are robotically spotted • An antibody is used to measure amount of a particular protein present in the sample • Limitation: Measure one protein per slide • Advantage: All samples analyzed side-by-side in a single array • Can compare protein levels across samples rather than samples across protein type
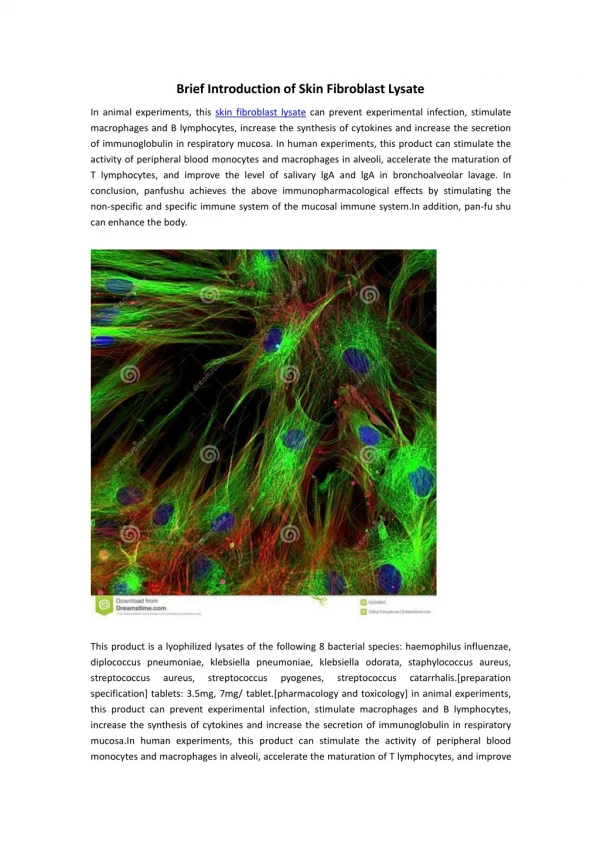
Protein lysate preparation • Lysis: The dissolution or destruction of cells by the action of a specific lysin that disrupts the cell membrane • Lysate: The cellular debris and fluid produced by lysis
Protein Lysate Array Design • Each microarray is a glass slide containing particular protein samples from different patients • 18 spots for every sample • 3 replicates • 6 dilution levels (with dilution factor of 2)
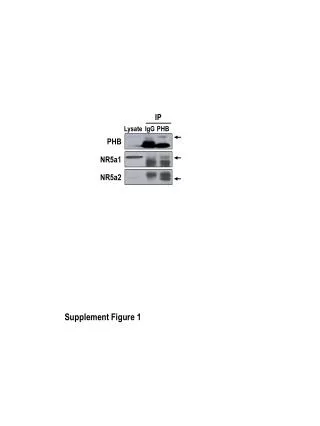
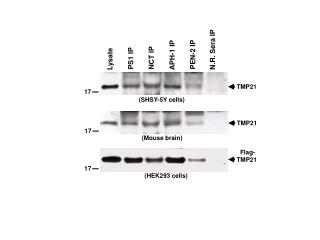
Western Blotting—used to screen specificity of antibodies • Choose Antibody that will bind to protein
Detection of protein on microarray • The slide is exposed to the antibody • Antibody binds to the protein, depending on how much protein is present • Microarray is scanned to form an image with darker spots reflecting higher levels of protein • Use two antibody detection system
From Image to Number • Software draws a circle around each spot • Darker spots have greater quantities of protein • sVOL reflects the total amount of protein Two-fold serial dilutions sVOL = (πr2)[(average intensity inside circle)-(average background intensity)]
The Data Set • 80 x 6 x 3 matrix of sVOL values for the caspase protein • 80 patients on one microarray chip • 6 two-fold serial dilutions for each patient • 3 replicates for each patient • Control serum data set for calibration and error-assessment purposes Dilutions P A T I E N T S 1 6 80
Potential Tasks to Undertake • From the 18 sVOL values for each sample, extract a single robust number that is representative of that sample ° for example, the mean is not robust • Provide an error estimate of that number
Saturation DetectionDevise procedure for extracting linear portion of log(sVOL) For highly concentrated samples, circles drawn by computer may be too small (sVOL smaller than expected) For large dilutions, sVOL is dominated by background noise (sVOL tails off)
Fine Tuning the Segmentation Program • Outlying sVOL values may occur even when saturation is not a problem • Detecting outliers may help improve the segmentation software