Download
1 / 1
20 likes | 186 Views
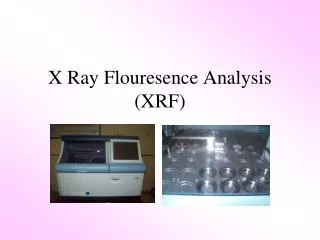
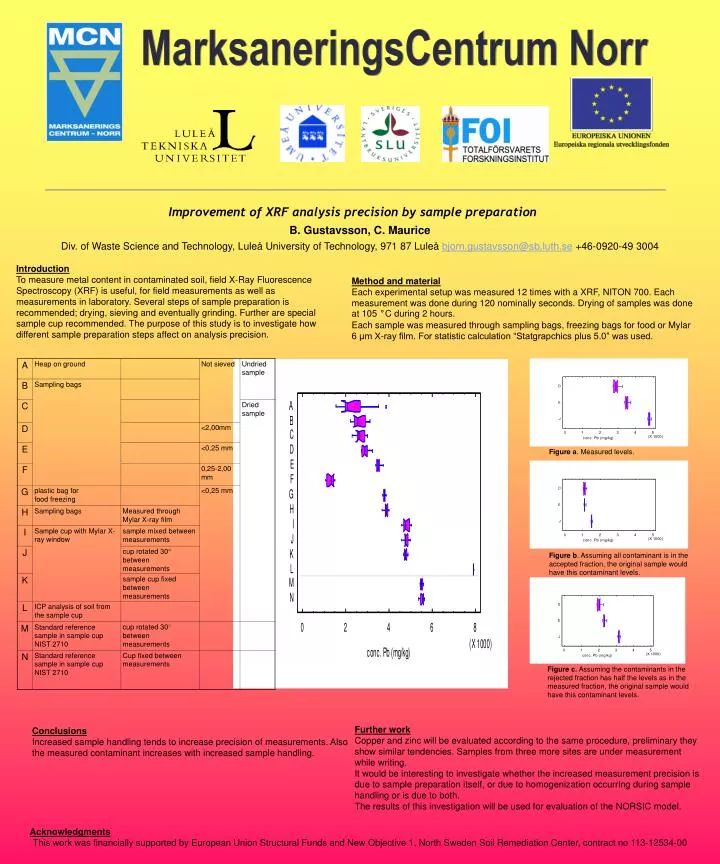
MarksaneringsCentrum Norr. Improvement of XRF analysis precision by sample preparation. B. Gustavsson, C. Maurice Div. of Waste Science and Technology, Luleå University of Technology, 971 87 Luleå bjorn.gustavsson@sb.luth.se +46-0920-49 3004. Introduction

E N D
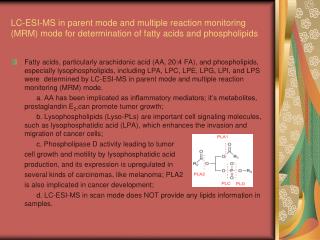
MarksaneringsCentrum Norr Improvement of XRF analysis precision by sample preparation B. Gustavsson, C. Maurice Div. of Waste Science and Technology, Luleå University of Technology, 971 87 Luleå bjorn.gustavsson@sb.luth.se +46-0920-49 3004 Introduction To measure metal content in contaminated soil, field X-Ray Fluorescence Spectroscopy (XRF) is useful, for field measurements as well as measurements in laboratory. Several steps of sample preparation is recommended; drying, sieving and eventually grinding. Further are special sample cup recommended. The purpose of this study is to investigate how different sample preparation steps affect on analysis precision. Method and material Each experimental setup was measured 12 times with a XRF, NITON 700. Each measurement was done during 120 nominally seconds. Drying of samples was done at 105 °C during 2 hours. Each sample was measured through sampling bags, freezing bags for food or Mylar 6 μm X-ray film. For statistic calculation “Statgrapchics plus 5.0” was used. Figure a. Measured levels. Figure b. Assuming all contaminant is in the accepted fraction, the original sample would have this contaminant levels. Figure c. Assuming the contaminants in the rejected fraction has half the levels as in the measured fraction, the original sample would have this contaminant levels. Further work Copper and zinc will be evaluated according to the same procedure, preliminary they show similar tendencies. Samples from three more sites are under measurement while writing. It would be interesting to investigate whether the increased measurement precision is due to sample preparation itself, or due to homogenization occurring during sample handling or is due to both. The results of this investigation will be used for evaluation of the NORSIC model. Conclusions Increased sample handling tends to increase precision of measurements. Also the measured contaminant increases with increased sample handling. Acknowledgments This work was financially supported by European Union Structural Funds and New Objective 1, North Sweden Soil Remediation Center, contract no 113-12534-00