
Introduction
Low Trust. Intermediate Trust. High Trust. Low Trust. High Trust. Low Trust. Intermediate Trust. High Trust. Fatima Diab, Sarah Javaid, Carolyn Hally, Amy Varner, Jacquie McCarthy, John Horigan, Dr. Terrie Rife DEPARTMENT OF BIOLOGY, JAMES MADISON UNIVERSITY.

Introduction
E N D
Presentation Transcript
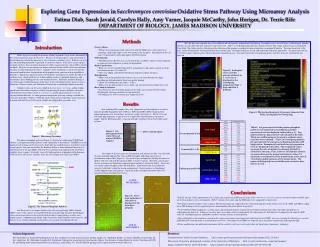
Low Trust Intermediate Trust High Trust Low Trust High Trust Low Trust Intermediate Trust High Trust Fatima Diab, Sarah Javaid, Carolyn Hally, Amy Varner, Jacquie McCarthy, John Horigan, Dr. Terrie Rife DEPARTMENT OF BIOLOGY, JAMES MADISON UNIVERSITY Exploring Gene Expression in Sacchromyces cerevisiae Oxidative Stress Pathway Using Microarray Analysis Methods Once the data were captured, they were modified and subsequently imported into GeneSpring. Scatterplots were viewed (Figure 5) indicating all genomic elements on each slide with their respective expression levels. Slide 1 showed high underexpression, which correlates with a large amount of green background. Using Slide 2 for further analysis, the physical classification of the genome according to chromosomal loci was mapped (Figure 6). The expression level of the genes can be determined by referring to the bar shown on the right. Overexpressed genes are red, and underexpressed genes appear blue. An expression value of 1.0 (yellow region) indicates genes whose expression remained constant. Gray represents no data for particular genes, and these genes are subsequently not analyzed. Introduction • Yeast Cultures • Mutant strain containing a high-copy vector with the ZMS1 gene, and control strain containing a high-copy empty vector were grown to the log phase. Degradation of the cell walls was performed to form spheroplasts for RNA isolation. • RNA Isolation • The RNAsafe kit (Bio101) was used to isolate the yeast RNA, which was then subjected to agarose gel electrophoresis to check for degradation. • Probe Construction • RNA was reverse transcribed into cDNA, using primers with capture sequences for the two fluorescent dyes, Cy3 and Cy5. • Dyes were added, and allowed to bind their respective capture sequences. • Hybridization • Slides were steamed and rinsed to remove excess salt and to denature the oligos, preceding pre-hybridization to block non-specific binding. • cDNA was hybridized to the slides (~ 4 days). • Slides were washed to remove excess probe, and sent to Davidson College to be read • Data Analysis Software • ScanAlyze was used to load the images of the slides and to capture the data within defined grids, allowing calculation of spot intensities. • GeneSpring was used to analyze gene expression levels. While oxygen is essential in sustaining aerobic organisms, it can also be detrimental to the normal cellular functions of eukaryotes. Excesses of oxygen radicals, generated mainly in the mitochondria, subject the organism to what is known as oxidative stress. Radicals can be in the form of hydrogen peroxide, superoxide, or hydroxyl radicals. Since these oxygen species are highly reactive, they can initiate damages to cellular macromolecules such as DNA, protein, and lipids. Reactive oxygen species can induce numerous lesions in DNA that cause deletions, mutations or other lethal genetic effects. Oxidative attack on proteins results in site-specific amino acid modifications, fragmentation of the peptide chain, and increased susceptibility to proteolysis. Eukaryotic organisms have evolved defense mechanisms to combat the effects of oxidative stress, which entail the use of both cellular (catalase, superoxide dismutase) and extracellular (metal binding proteins) anti-oxidant defenses. Inherently, oxidative damage is one of the major contributing factors in the onset of age-related degenerative diseases such as Alzheimer’s Disease, stroke, and Parkinson’s Disease due to inadequate cellular protection. Oxidative stress can be easily studied in Saccharomyces cerevisiae, and knowledge gained from such studies can prove useful in extrapolating the process in higher eukaryotes. Commonly known as baker’s yeast, S. cerevisiae is a model organism because it can be cultured without difficulty. Its entire genomic composition is known, making it suitable for microarray procedures (Figure 1). With the advent of microarray technology, gene expression in mutant and control yeast cells can be studied and compared on a genomic scale. The pentose phosphate pathway (Figure 2), involved in synthesizing NADPH and ribulose, is an important cellular process in the elimination of free radicals. NADPH serves the important role of being an electron carrier. It provides the needed electrons to stabilize reactive oxygen species. Previous research by Dr. Kimberly Slekar at James Madison University has spurred interest in the gene ZMS1, believed to be a potential transcription factor involved in oxidative stress response. Evidently, yeast cells lacking glucose-6-phosphate dehydrogenase (ZWF1D) were able survive oxidative stress due to overepxression of the gene ZMS1. Our focus here is to compare mutant yeast cells overexpressing ZMS1, denoted ZMS1++ cells, to the control. It is hypothesized that overexpressing this gene should trigger expression of genes known to be involved in the oxidative repair pathway or other stress response genes. Additional goals of this study are to better understand microarray analysis, and discover ways of representing the collected data sets using the GeneSpring software. Figure 5: Scatterplot views of all the genomic elements in S. cerevisiae asdisplayed in the GeneSpring program for Slide 1 (top) and Slide 2 (bottom). Results After isolating RNA samples, they were subjected to gel electrophoresis in order to check for possible degradation due to RNases. Ribosomal RNA (rRNA) bands in both control and mutant cells were distinct and clearly visible (see Figure 3). The 5S, 18S, and 28S bands appeared intact, except there was a slight DNA contamination in the mutant sample. Had the rRNA degraded, a smearing of bands would have been observed down the gel lanes. Yeast Cells Figure 6:Physical positioning of all genomic elements from Slide 2 as displayed in GeneSpring. RNA 70mer Oligos US cDNA C M Table 1: Six genes involved in the pentose phosphate pathway were examined in GeneSpring, and their expression levels are displayed, indicated by a (*). Two genes yielded no data and were not included in the table. Thirty-two additional genes involved in oxidative stress response were examined. “Trust” in GeneSpring indicates the spot intensity for each gene, indicating good data with bright colors. Examples of trust levels for each expression level are displayed in the table. The normalized values represent the ratio of mutant dye intensity divided by control dye intensity. Thus, a ratio of 1.0 indicates constant expression between the mutant and control, a ratio of >1 represents overexpression of the mutant strain, and a ratio of <1 indicates underexpression of the mutant strain. The genes exhibiting high trust yield the most conclusive data (shown in red). 28S Figure 3: Gel photograph of the control (C) and mutant (M) RNA samples DNA Contamination Figure 1: Microarray Procedure 18S 5S Intermediate Trust Two copies of all yeast genes are contained on each microarray slide. On each slide, the spots generally appeared the same on both metagrids, indicating consistency in hybridization within slides (Figure 4). Dye reversal was attempted by labeling the mutant on Slide 1 with Cy5 (red) and the mutant on Slide 2 with Cy3 (green). Therefore, control genes that are overexpressed should have appeared green on Slide 1 and red on Slide 2. Genes that are equally expressed appear yellow on both slides. Upon observation in ScanAnalyze, however, both slides yielded the similar color patterns. Further analysis in GeneSpring yielded opposite expression patterns. This leads to the assumption that both slides were actually performed without dye reversal. ZWF1 Grid 18 METAGRID 1 Slide 1 Slide 2 • Conclusions • Initially, the aim of this experiment was to examine gene expression in different cell types of Saccharomyces cerevisiae, or yeast, in order to understand how genes involved in oxidative stress are regulated. ZMS1++ mutants over-expressing the ZMS1 gene were compared to control cells. • Two genes related to oxidative stress response showed overexpression compared to the control with high trust in the mutant yeast strain: ATM1 and GRX1, coding for an ATP-binding cassette transporter protein (mitochondrial) and glutaredoxin, respectively. • Genes GSH1and ATX1(coding for a cysteine ligase and antioxidant protein, respectively) had similar normalization values and expression patterns of underexpression, high trust. Likewise, two other genes were shown to have exceptionally low expression rates with high trust (compared to the control); HIP1 codes for a histidine permease, and ROD2 encodes a calcium and zinc resistant protein. • Our resulting data is not conclusive enough to draw major conclusions concerning exact expression levels of ZMS1, however assuming dye labeling was accurate; ZMS1did show overexpression at an intermediate trust level. Overexpression of ZMS1was expected since our mutant contained the high-copy plasmid. • Future modifications and additional experiments will be needed to verify our results and further our knowledge of microarray technology. Figure 4: Views from both sides of each slide as displayed in the ScanAlyze program. Figure2: The Pentose-Phosphate Pathway Grid 42 METAGRID 2 Resources: Comprehensive Yeast Genome Database: http://mips.gsf.de/proj/yeast/catalogues/phenotype/fc62_15.html Microarray Procedure photograph courtesy of the University of Michigan: http://www.umich.edu/~caparray/images/ Aging, Oxidative Stress, and Cell Death: http://grants.nih.gov/grants/guide/pa-files/PA-00-081.html Acknowledgements: We would like to thank Heidi Hartman for her assistance in the initial phases of this study, Dr. Kimberly Slekar of James Madison University for her expertise, Dr. Malcolm Campbell of Davidson College for scanning our microarray slides, the Genome Consortium for Active Teaching (GCAT) for providing web-based and software resources, and lastly, Dr. Terrie Rife for giving us the opportunity to work with her.


