Download
1 / 9
90 likes | 178 Views
Explore the extent, causes, and impact of TCP round-trip time variability within connections. Discover how mean RTT relates to per-segment RTTs, potential causes of variability, and the implications on TCP analytical models and simulations. Enhance your understanding of RTT variability for more accurate network performance assessments.

E N D
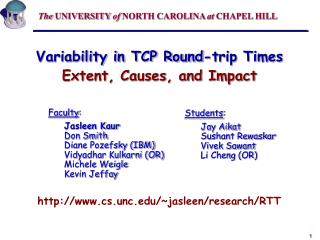
The UNIVERSITY of NORTH CAROLINA at CHAPEL HILL Variability in TCP Round-trip TimesExtent, Causes, and Impact • Faculty: • Jasleen Kaur • Don Smith • Diane Pozefsky (IBM) • Vidyadhar Kulkarni (OR) • Michele Weigle • Kevin Jeffay • Students: • Jay Aikat • Sushant Rewaskar • Vivek Sawant • Li Cheng (OR) http://www.cs.unc.edu/~jasleen/research/RTT
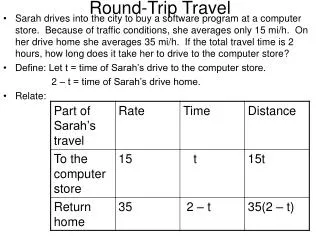
TCP Round-trip Times (RTTs) Popular belief: RTTs do not vary significantly within TCP connections • Mean RTT can be used to approximate per-segment RTTs • TCP analytical models [Altman00, Kumar98, Lakshman97, Mathis97, Padhye98, Zhang02…] • RTT of initial segments is “typical” for a TCP connection [Jiang02] Do per-segment RTTs vary significantly within a TCP connection?
Data Source UNC Campus ibiblio web servers Regional health-care center Departments Research labs Rest of the world Residence halls ISP router Wireless users VPNs Modem Monitor Rich data source!
Trace Statistics Large data set!
Variability Within Connections • Median RTT: • 30% of connections see a median RTT more than twice the min RTT • 90% RTT: • 22% of connections see a 90% RTT more than 5 times the min RTT • 90% RTT increases with min RTT
Causes of Variability • Correlation with hop-count • Correlation with location • Prefix-aggregation • Behavior with time • Timescales • Congestion • Path changes
Per-Segment RTTs: Mean or Distributions? • Is mean RTT a good approximation for per-segment RTTs? • TCP analytical models • TCP evaluation (simulations)
Impact of variability • Models for per-connection RTTs • Accurate simulation environments • Accurate analysis • Impact of RTT variability on past work • TCP analytical models • Delay-based congestion control • TCP evaluation (simulations) • TCP-based analysis
The SYN/(SYN+ACK) RTT • RTT yielded by the SYN and SYN+ACK pair • Differs by more than 10% from min RTT for 14% of connections • Differs by more than 10% from median RTT for 50% of connections