Download
1 / 20
200 likes | 280 Views
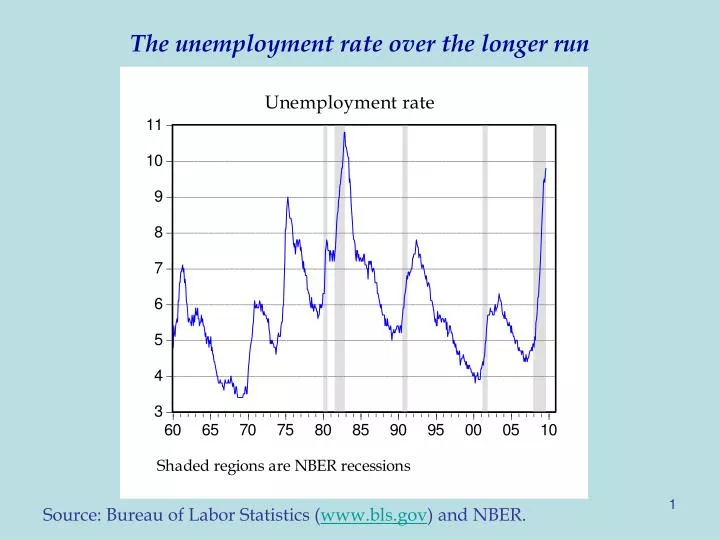
The unemployment rate over the longer run. Source: Bureau of Labor Statistics ( www.bls.gov ) and NBER. Alternative Measures of Unemployment. Source: Bureau of Labor Statistics (www.bls.gov). Mean duration of unemployment.

E N D
The unemployment rate over the longer run Source: Bureau of Labor Statistics (www.bls.gov) and NBER.
Alternative Measures of Unemployment Source: Bureau of Labor Statistics (www.bls.gov)
Mean duration of unemployment Source: Data from Bureau of Labor Statistics; graph from FRED (St Louis Fed)
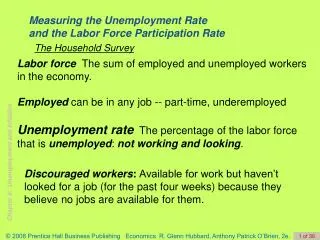
The Current Population Survey (CPS) • Source of data for monthly unemployment, employment, labor force data. • Overview of the survey • 50,000 households • “scientifically selected to represent the civilian non-institutional population” • provides estimates of employment, unemployment, earnings, hours of work, and other indicators • Definitions: • Employed = worked for pay or absent from job for cause • Unemployed = not working plus actively looking for work • Labor force = E + U For further information, see http://www.bls.census.gov/cps/cpsbasic.htm
How do labor markets respond to shift in demand? This is on the fault line of modern macro
Original equilibrium W/P E1 = E*1 (W/P)1 MPL Labor supply, employment 6
Labor demand shift and market clearing W/P E1 = E*1 (W/P)1 E*2 MPL Labor supply, employment 7
Because wages sticky, have disequilibrium W/P E1 = E*1 (W/P)1 E2 E*2 MPL Labor supply, employment 8
Because wages sticky, have disequilibrium W/P - The line E2E1 is unemployment. - Upward shift in L demand leads to vacancies. E1 (W/P)1 E2 MPL Labor supply, employment 9
Theories of Unemployment Market-clearing (Walrasian) • Wages move to clear supply and demand • Workers would be on supply curves; unemployment would be “voluntary” Non-market-clearing (non-Walrasian): Wages are not determined in auction markets • In one version, there are flexible-wage, decentralized markets • In another version, real or nominal wages are “sticky” - If firms determine employment (are on their demand schedules), then workers may be off curves and jobs rationed.
How do wages respond to a glut of workers? Recall a glut of tankers. Price of “Dryships” shipping company:
Classical-Type Theories of Unemployment • “New classical models”: Unemployment from confusion about relative prices and wages • Search models: Unemployment arises from “search” and “labor market frictions” (Mortensen-Pissarides model is standard) • Firms and workers are like molecules, bouncing around looking for jobs or workers. • This leads to equilibrium “frictional” unemployment depending on various parameters. • Example: Oil price shock forces workers to move from energy-intensive to other industries. • However, does not generally give sticky wages or correct cyclical predictions. • Some (not all) classical models predict that vacancies and unemployment rise together.
Keynesian Theories of Unemployment Involuntary and cyclical unemployment arise because of wage stickiness “Wage stickiness” means that wages do not fully react to shock to supply and demand. Reasons for wage stickiness : • Government policies (minimum wages) • Private contracts (labor union contracts) • Behavioral factors (morale, custom, efficiency wages) Predicts that unemployment and vacancies will move in opposite direction.
How much are the unemployed searching Alan B. Krueger and Andreas Mueller, “The Lot of the Unemployed: A Time Use Perspective”. “Min” are minutes per day.
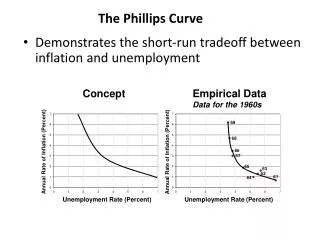
Some key empirical regularities of the labor market Okun’s Law: unemployment moves inversely with Y Beveridge Curve: Unemployment moves inversely with vacancy rate Phillips Curve: Inflation moves inversely with unemployment (in short run)
Okun’s Law from Keynesian Approach: • Change in (unemployment rate – NAIRU) • = α (real GDP growth – potential real GDP growth) • or approximately: • Δ U = αx (real GDP growth), where α = -0.3 to -0.5
Data suggests most movements are as predicted by sticky-wage model.But periods of turmoil (1980s) have shift in curve.Source: FRBSF Economic Letter, 2006-08; April 21, 2006, Job Matching: Evidence from the Beveridge Curve
Final Thoughts on Unemployment High unemployment is one of the most traumatic of economic outcomes. Modern macro has not yet succeeded in developing a complete microeconomic theory to explain the phenomena of sticky wages and unemployment. Stay tuned!