Download
1 / 39
390 likes | 578 Views
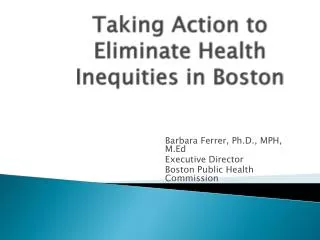
Taking Action to Eliminate Health Inequities in Boston. Barbara Ferrer , Ph.D., MPH, M.Ed Executive Director Boston Public Health Commission. Racial Disparities in Boston, 2008. Health Indicator Black White Asthma (< 5, hosp) 16.2 per 1000 4.1

E N D
Taking Action to Eliminate Health Inequities in Boston Barbara Ferrer, Ph.D., MPH, M.Ed Executive Director Boston Public Health Commission
Racial Disparities in Boston, 2008 Health Indicator Black White Asthma (< 5, hosp) 16.2 per 1000 4.1 Birth Weight (Less than 3.3lbs) 3.0% of births 0.8% Body Weight (Overweight or Obese) 61%50% Breast Cancer (Morality) 38.2 per 100,000 19.8 Death Rate (Mortality) 1,035.2 per 100,000 714.2 Diabetes (Mortality) 38.4 per 100,000 11.9 Drug Related Mortality 27.0 per 100,000 29.9 Heart Disease (Mortality) 200.8 per 100,000 140.0 High Blood Pressure 30%24% HIV/AIDS (Mortality) 12.2 per 100,000 3.1 Homicide31.1 per 100,000 n<5 Hospitalization 169.6 per 1,00097.2 Infant Mortality (Mortality) 14.6 per 1,0003.4 Lung Cancer (Mortality) 51.3 per 100,000 48.3 Prostate Cancer (Mortality) 72.7 per 100,000 22.2 Smoking during pregnancy 3.8% 4.2% Suicide (Mortality) 5.07.1 Teen Birth Rate (15 - 17) 18.9 per 1,000 12.7 Uninsured 2.7%1.0%
DATA SOURCE: Boston resident live births and deaths, Massachusetts Department of Public Health DATA ANALYSIS: Boston Public Health Commission Research and Evaluation Office
DATA SOURCE: Boston Resident Deaths, Massachusetts Department of Public Health • DATA ANALYSIS: Boston Public Health Commission Research and Evaluation Office
NOTE: These data do not include persons whose race/ethnicity and maternal education were not reported. DATA SOURCE: Boston resident live births, Massachusetts Department of Public Health. DATA ANALYSIS: Boston Public Health Commission Research and Evaluation Office
Racial & Ethnic DisparitiesInfant Mortality & Household Income 16.6 11.2
NOTE: These data do not include persons whose race/ethnicity and smoking status were not reported. DATA SOURCE: Boston resident live births, Massachusetts Department of Public Health. DATA ANALYSIS: Boston Public Health Commission Research and Evaluation Office 9
NOTE: These data do not include persons whose race/ethnicity and smoking status were not reported. DATA SOURCE: Boston resident live births, Massachusetts Department of Public Health. DATA ANALYSIS: Boston Public Health Commission Research and Evaluation Office 10
Racial & Ethnic DisparitiesInfant Mortality & Prenatal Care 12.7 7.1 DATA SOURCE: Infant Mortality Statistics from the 2003 Period Linked Birth/Infant Death Data Set, National vital statistics reports; vol. 54, no. 16. Hyattsville, MD; National Center for Health Statistics, 2006
Is It About Race? • Race has no clear biologic or genetic basis…“there are no characteristics, no traits, not even one gene that turns up in all members of one so-called race, yet is absent from others” (L. Adelman. Race and Gene Studies) • The meanings of racial designations- White, Black, Asian- are subject to historical, cultural and political forces; “race justified social inequalities as natural”.
Racial & Ethnic DisparitiesInfant Mortality & Nativity, 2003 Per 1,000 Live Births 13.8 9.3 DATA SOURCE: Infant Mortality Statistics from the 2003 Period Linked Birth/Infant Death Data Set, National vital statistics reports; vol. 54, no. 16. Hyattsville, MD; National Center for Health Statistics, 2006
How Can Racism Affect Health Status? • Differences in socio-economic status and environmental conditions • Differences in exposure to “stress” • Differences in access to health care services • Differences in diagnostic testing, treatment, and the quality of care received within the health care system • Differences in health behaviors
Environmental Exposures • Exposure to waste disposal sites • Exposure to air pollutants • Exposure to “unregulated” job sites (housecleaning, sweat shops, farms) • Exposure to sub-standard housing (quality, density, location) • Exposure to alcohol and tobacco products and unhealthy foods • Exposure to violence
*Includes the North End †Includes Chinatown DATA SOURCE: Acute Care Hospital Case Mix files, Massachusetts Division of Health Care Finance and Policy DATA ANALYSIS: Boston Public Health Commission Research Office
Figure 30.22 Homicides, 2006-2008 Combined NOTE: Data are presented as age-adjusted rates. Neighborhoods are defined by zip codes. DATA SOURCE: Boston resident deaths, Massachusetts Department of Public Health DATA ANALYSIS: Boston Public Health Commission Research and Evaluation Office MAP CREATED BY: Boston Public Health Commission Research and Evaluation Office
Figure 30.15b Obese Adult Residents, 2006-2008 Combined NOTE: Body Mass Index (BMI) is calculated from self-reported weight and height. An adult who has a BMI of 30 or higher is considered obese. These data do not include persons of 'Other' or unknown race/ethnicity. Neighborhoods are defined by zip codes. DATA SOURCE: Boston Behavioral Risk Factor Survey, 2006 and 2008, Boston Behavior Surveillance System (BBRFSS), Boston Public Health Commission DATA ANALYSIS: Boston Public Health Commission Research and Evaluation Office MAP CREATED BY: Boston Public Health Commission Research and Evaluation Office
Stress • Understanding the biologic impacts of social stress (Wadhwa et al. 2001., Culhane et al. 2001., Kramer et al. 2001 ) • Theory of allostatic load (Michael Lu. 2002, Rich-Edwards. 2001) “ ..a woman’s chronic exposure to racism creates an allostatic load ..altering the endocrine milieu in which the placenta is established….” (Rich-Edwards. 2001)
Stress Photo: http://www.lam.mus.ca.us/cats/encyclo/smilodon/
Allostasis: Maintain Stability through Change McEwen BS. Protective and damaging effects of stress mediators. N Eng J Med. 1998;338:171-9.
Allostastic Load McEwen BS. Protective and damaging effects of stress mediators. N Eng J Med. 1998;338:171-9.
Allostatic Load McEwen BS, Lasley EN. The end of stress: As we know it. Washington DC: John Henry Press. 2002
Stressed vs. Stressed Out • Stressed • Increased cardiac output • Increased available glucose • Enhanced immune functions • Growth of neurons in hippocampus & prefrontal cortex • Stressed Out • Hypertension & cardiovascular diseases • Glucose intolerance & insulin resistance • Infection & inflammation • Atrophy & death of neurons in hippocampus & prefrontal cortex
Health Behaviors • Individual behavior exists within a social context • Internalized racism can affect health behavior • Health behavior alone does not account for unequal burden of disease and death
Evidence of Racial and Ethnic Disparities in Healthcare • Disparities consistently found across a wide range of disease areas and clinical services • Disparities are found even when clinical factors, such as stage of disease presentation, co-morbidities, age, and severity of disease are taken into account • Disparities are found across a range of clinical settings, including public and private hospitals, teaching and non-teaching hospitals, etc. • Disparities in care are associated with higher mortality among minorities (e.g., Bach et al., 1999; Peterson et al., 1997; Bennett et al., 1995)
Boston’s efforts to address racial and ethnic inequities in health www.bphc.org/disparities
Guiding Principles • Evidence based foundation: data collection, analysis and dissemination of relevant information • Community capacity building and coalition development are the pillars of the work • Inequities considered as a central issue and elimination strategies are integrated into core public health functions • Working upstream with non-traditional partners is required to address root causes of inequities • Funding is directed to support efforts to eliminate inequities
Institutional Framework for Promoting Health Equity • Develop institutional competency to engage in sustained efforts to eliminate inequities • Support/build community capacity to lead and engage in efforts to eliminate inequities • Identify partnership opportunities to enhance and promote efforts to eliminate inequities
Building Institutional Capacity • Providing employee education and training opportunities (core competencies and leadership development) • Integrating elimination of inequities in every program (logic models, goals, objectives, activities and evaluation) • Identifying and changing internal policies that may perpetuate inequities (ARAC)
3 overarching 5-year goals • Reduce low birth weight rates among Boston residents and reduce the gap in low birth weight rates between Black and White Boston residents by 25%. • Reduce obesity rates among Boston residents and reduce the gap between White and Black/Latino combined obesity/overweight rates by 30% for children and youth and by 20% for adults. • Reduce Chlamydia rates among Boston residents 15 through 24 years of age and reduce the gap in Chlamydia rates between Black, Latino, and White residents 15 through 24 years of age by 25%.
Building Community Capacity • $3 million investment to 54 community and health institutions to address health disparities • Key Project Areas: Data Collection, Health Systems, Raising Public Awareness, Workforce Diversity, Patient Education, Violence Prevention and Trauma Response, and Food Access/Obesity Prevention
Building Partnerships -- Policy and Advocacy • Legislative advocacy and voter education: • Violence Prevention Bill • CORI reform • Re-entry Bill • Active engagement with State efforts such as Disparities Council, Governor Patrick administration, and Executive Office of Health and Human Services, and the MA Department of Public Health • Board of Health regulatory authority • - tobacco control • - permitting and inspecting
Where to start ….. • Promote a diverse workforce and leadership team • Establish institutional and personal cultural competence • Build and sustain diverse partnerships • Collect appropriate data to understand the challenge, measure progress and establish accountability • Work “upstream” to address root causes of health inequities in health outcomes
Work Upstream… • Strongly oppose discrimination and racism in all settings • Support affordable, healthy housing • Promote local opportunities for safe exercise and recreational activities • Promote local opportunities for healthy, quality affordable foods • Invest in public education and job training
Refocus Activities • Focus on policies that are good for health, not just health policies • Fund efforts promoting community health • Build strategic partnerships