Optimizing Machine Processing Time and Layout for Enhanced Environmental Analysis Efficiency
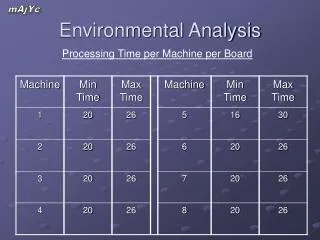
This document analyzes the processing times per machine and per board in an environmental analysis setup, focusing on time constraints and downtime within shifts. The problem statement is addressed through a methodology that includes measuring room dimensions, simulating different layouts, and analyzing output data metrics like mean and standard deviation. It culminates in recommendations for optimal layouts with a focus on improving operational efficiency while managing costs. The findings suggest a specific layout design that maximizes throughput and minimizes waste.

Optimizing Machine Processing Time and Layout for Enhanced Environmental Analysis Efficiency
E N D
Presentation Transcript
mAjYc Environmental Analysis Processing Time per Machine per Board
mAjYc Environmental Analysis Selected Miscellaneous Data
mAjYc Problem Statement Time Constraints Time per Shift 480 min Average Downtime- 30 min Working Time per Shift 450 min Shifts per Day (2) x 2 shifts Days per Month x 20 days Months per Yearx 13 months Processing Time per Year 3,900 hours Quota: 9,360 Boards per Year Maintenance assumed to take place in the 3rd shift
mAjYc Methodology • Find feasible layouts • Measure room dimensions (account for pillars) • Arrange stations in order • Run simulation on different layouts • Define distribution (Uniform vs. Triangular) • Scrap rate • Rework rate • Collect output data • Mean • Standard Deviation • Perform Case Analysis
mAjYc Feasible Layouts • Optional second door
mAjYc Simulation Results * Rounding the mean down and standard deviation up
mAjYc Recommendation • Layout 2 • 99% Confidence Interval:
mAjYc Expected Case
mAjYc Worst Case
mAjYc Cost Analysis
mAjYc Cost Analysis