Download
1 / 21
210 likes | 374 Views
Chapter 5. Supply 5.1 The Supply curve 5.2 shifts of supply curve 5.3 production and cost. 5.1 The Supply Curve. Profit = Total Revenue – Total Cost Break Even= No profit, no loss of money. Profit- Money made after expenses are paid. Loss- Money lost after expenses are paid. Supply.

E N D
Chapter 5 Supply5.1 The Supply curve5.2 shifts of supply curve5.3 production and cost
5.1 The Supply Curve • Profit = Total Revenue – Total Cost • Break Even= No profit, no loss of money. • Profit- Money made after expenses are paid. • Loss- Money lost after expenses are paid.
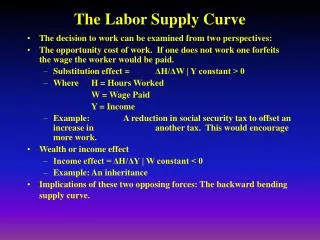
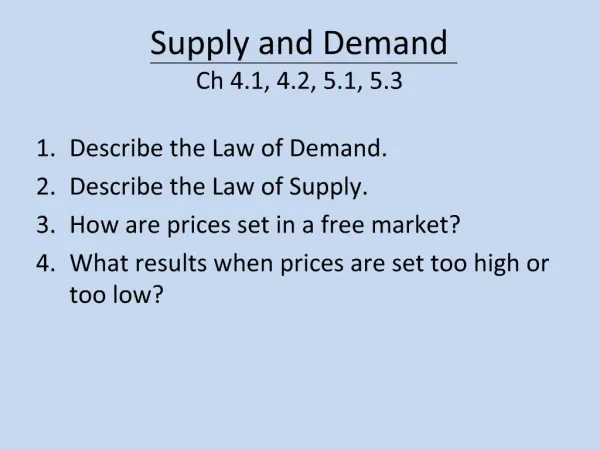
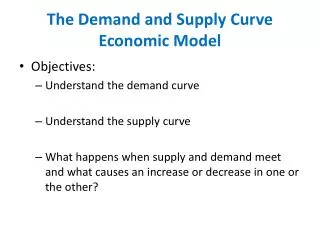
Supply • Supply- A relationship showing the quantities of a good producers are willing and able to sell at various prices during a given period, other things constant. • EX- If prices are low, then it is likely to have a higher supply of an item. If an item is rare, it is more likely that supply will be low.
Law of Supply • Law of Supply-The quantity of a good supplied during a given time period is usually directly related to its price, other things constant. • Lower the price, the smaller the quantity supplied. Higher the price, the more likely the demand may be higher.
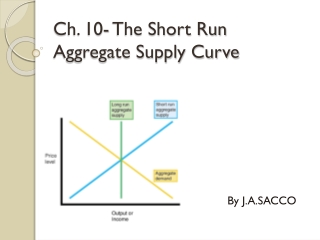
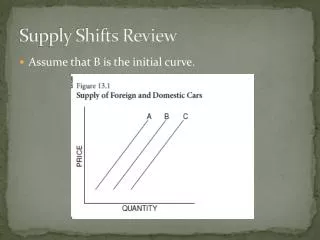
Supply Curve • Supply Curve- A curve or line showing the quantities of a particular good supplied at various prices during a given time period, other things constant.
More Willing to Supply • A higher pizza price makes pizza production more profitable and attracts resources from lower-valued uses. • If prices can increase and people are still buying a product, then it is still beneficial to create that product. If prices are low and no one is buying, the company may not produce it anymore.
Supply • More Able to supply- A higher price makes producers more able to increase quantity supplied. • EX- The more profit a company makes the more they can produce of an item.
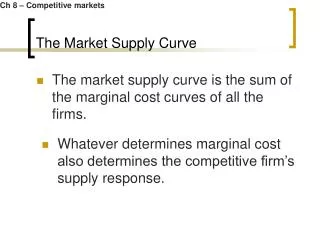
Supply • Individual Supply- Supply made by one person or business. Market Supply- Supply of all producers in the market.
Elasticity of Supply • Prices are signals to both sides of the market. If an items price is too high, then no one will buy it. When you lower the price and people begin to buy it, then that will tell you what the real value of the item really is. Same thing if an items price is too low, people will buy it up.
Measurement • Elasticity of Supply- A measurement of the responsiveness of quantity supplied to price change. • EX- Housing Market
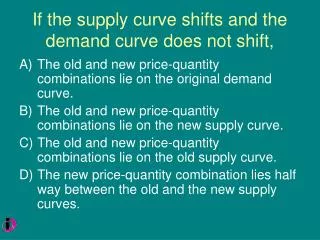
5.2 Shifts of the Supply Curve • Determinants of Supply • 1. The cost of resources used to make the good. • 2.The price of other goods these resources could make. • 3. The technology used to make the good. • 4. Producer expectations. • 5.Number of sellers in the market.
Change in the Price of Resources • If a trees become scarce, then what will happen to paper? • If you can turn steel into gold, what will happen to the price of gold? • Availability of resources effect prices.
Changes in Technology • With advances in technology, prices go up and down as technology becomes more advanced or obsolete. A new iPad may cost you $500.00 right now, next year, that same model will cost you $150.00. • Digital Watches, when they first came out, they were expensive, now you can buy them for a $1.00.
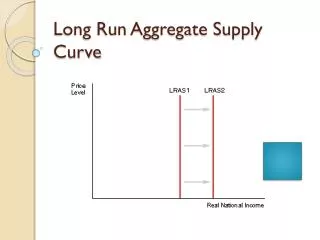
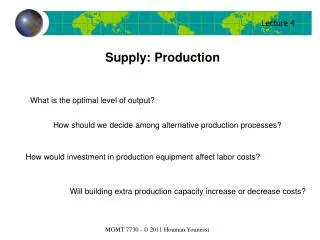
5.3 Production and Cost • Short Run- A period during which at least one of the firm’s resources are fixed. • Long Run- A period during which all resources can be varied. • Total Product- The total output of the firm.
Fixed and Variable Resources • Marginal Product- The change in total product resulting from a one-unit change in a particular resource.
Diminishing Returns • Law of Diminishing Return- As more of a variable resource is added to a given amount of fixed resources. Marginal products eventually declines and could become negative. • EX-Assembly line. 5 workers are great, but if you add one more, it may make people crowded and hurt production.
Cost in the short run • Fixed cost- Any production cost that is independently of a firms output. A cost that does not change. • Variable cost- Costs that change as output changes. One worker vs. 5 workers, which will get you more output when cleaning a yard?
Total Cost • Total Cost- The sum of fixed cost and variable cost. • EX- If you pay someone an hourly rate and a percentage of what they sell, that would be total cost.
Marginal Cost • Marginal Cost- The change in total cost resulting from a one-unit change in output. The change in total cost divided by the change in output. • EX- If the price of something goes up, it will effect the marginal cost of an item.
Marginal Revenue • Marginal Revenue- The change in total revenue from selling another unit of one good. • Lobsters- The first people to get in to port with the lobsters, sets the market price. The market price is what they sell the lobsters for. The money they now make is the marginal revenue.
Economies of Scale • Economies of Scale- Forces that reduce a firm’s average cost as the firm’s size or scale increases in the long run. EX- Larger the business, more money, better equipment they can get. It goes from a human assembly line to a robot arm making the products.