Download
1 / 1
10 likes | 158 Views
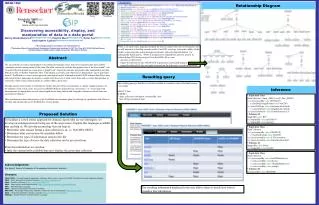
IN51A-1685. Discovering accessibility, display, and manipulation of data in a data portal Nancy Hoebelheinrich 1( nhoebel@kmotifs.com ) , Patrick West 2 ( westp@rpi.edu ) , Peter Fox 2 ( pfox@cs.rpi.edu ) , Christopher Lynnes 3 ( christopher.s.lynnes@nasa.gov )

E N D
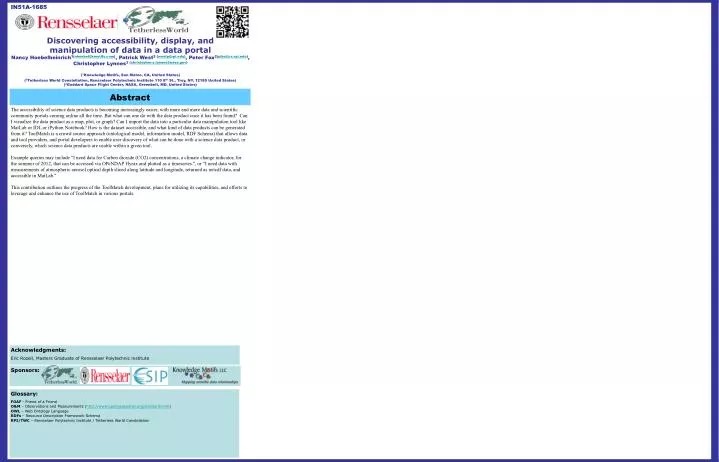
IN51A-1685 Discovering accessibility, display, and manipulation of data in a data portal Nancy Hoebelheinrich1(nhoebel@kmotifs.com), Patrick West2(westp@rpi.edu), Peter Fox2(pfox@cs.rpi.edu), Christopher Lynnes3 (christopher.s.lynnes@nasa.gov) (1Knowledge Motifs, San Mateo, CA, United States) (2Tetherless World Constellation, Rensselaer Polytechnic Institute 110 8th St., Troy, NY, 12180 United States) (3Goddard Space Flight Center, NASA, Greenbelt, MD, United States) Abstract The accessibility of science data products is becoming increasingly easier, with more and more data and scientific community portals coming online all the time. But what can one do with the data product once it has been found? Can I visualize the data product as a map, plot, or graph? Can I import the data into a particular data manipulation tool like MatLab or IDL or iPython Notebook? How is the dataset accessible, and what kind of data products can be generated from it? ToolMatch is a crowd source approach (ontological model, information model, RDF Schema) that allows data and tool providers, and portal developers to enable user discovery of what can be done with a science data product, or conversely, which science data products are usable within a given tool. Example queries may include "I need data for Carbon dioxide (CO2) concentrations, a climate change indicator, for the summer of 2012, that can be accessed via OPeNDAP Hyrax and plotted as a timeseries.", or "I need data with measurements of atmospheric aerosol optical depth sliced along latitude and longitude, returned as netcdf data, and accessible in MatLab." This contribution outlines the progress of the ToolMatch development, plans for utilizing its capabilities, and efforts to leverage and enhance the use of ToolMatch in various portals. Acknowledgments: Eric Rozell, Masters Graduate of Rensselaer Polytechnic institute Sponsors: Glossary: FOAF- Friend of a Friend O&M – Observations and Measurements (http://www.opengeospatial.org/standards/om) OWL – Web Ontology Language RDFs – Resource Description Framework Schema RPI/TWC – Rensselaer Polytechnic Institute / Tetherless World Constellation