Clustering Analysis Techniques for Microarray Gene Expression Data
This lecture covers the foundational concepts of clustering analysis within the context of microarray data. It discusses the difference between supervised and unsupervised learning, introduces various clustering algorithms, and highlights the importance of understanding computational artifacts. Clustering methods including hierarchical clustering, Euclidean and Manhattan distance metrics, and correlation measures are explored using gene expression data, emphasizing how to group similar gene profiles effectively. Students will learn to visualize data through heatmaps and dendrograms, paving the way for understanding complex biological datasets.

Clustering Analysis Techniques for Microarray Gene Expression Data
E N D
Presentation Transcript
CZ5225: Modeling and Simulation in BiologyLecture 3: Clustering Analysis for Microarray Data IProf. Chen Yu ZongTel: 6874-6877Email: yzchen@cz3.nus.edu.sghttp://xin.cz3.nus.edu.sgRoom 07-24, level 7, SOC1, NUS
Clustering Algorithms • Be weary - confounding computational artifacts are associated with all clustering algorithms. -You should always understand the basic concepts behind an algorithm before using it. • Anything will cluster! Garbage In means Garbage Out.
Supervised vs. Unsupervised Learning • Supervised: there is a teacher, class labels are known • Support vector machines • Backpropagation neural networks • Unsupervised: No teacher, class labels are unknown • Clustering • Self-organizing maps
Gene Expression Data Gene expression data on p genes for n samples mRNA samples sample1 sample2 sample3 sample4 sample5 … 1 0.46 0.30 0.80 1.51 0.90 ... 2 -0.10 0.49 0.24 0.06 0.46 ... 3 0.15 0.74 0.04 0.10 0.20 ... 4 -0.45 -1.03 -0.79 -0.56 -0.32 ... 5 -0.06 1.06 1.35 1.09 -1.09 ... Genes Gene expression level of gene i in mRNA sample j Log (Red intensity/Green intensity) = Log(Avg. PM - Avg. MM)
-2 2 Expression Vectors Gene Expression Vectors encapsulate the expression of a gene over a set of experimental conditions or sample types. 1.5 -0.8 1.8 0.5 -0.4 -1.3 1.5 0.8 Numeric Vector Line Graph Heatmap
Expression Vectors As Points in ‘Expression Space’ t 1 t 2 t 3 G1 -0.8 -0.3 -0.7 G2 -0.7 -0.8 -0.4 G3 Similar Expression -0.4 -0.6 -0.8 G4 0.9 1.2 1.3 G5 1.3 0.9 -0.6 Experiment 3 Experiment 2 Experiment 1
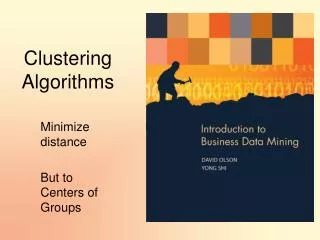
Cluster Analysis • Group a collection of objects into subsets or “clusters” such that objects within a cluster are closely related to one another than objects assigned to different clusters.
How can we do this? • What is closely related? • Distance or similarity metric • What is close? • Clustering algorithm • How do we minimize distance between objects in a group while maximizing distances between groups?
Distance Metrics (5.5,6) • Euclidean Distance measures average distance • Manhattan (City Block) measures average in each dimension • Correlation measures difference with respect to linear trends (3.5,4) Gene Expression 2 Gene Expression 1
Clustering Gene Expression Data Expression Measurements • Cluster across the rows, group genes together that behave similarly across different conditions. • Cluster across the columns, group different conditions together that behave similarly across most genes. j Genes i
Clustering Time Series Data • Measure gene expression on consecutive days • Gene Measurement matrix • G1= [1.2 4.0 5.0 1.0] • G2= [2.0 2.5 5.5 6.0] • G3= [4.5 3.0 2.5 1.0] • G4= [3.5 1.5 1.2 1.5]
Euclidean Distance • Distance is the square root of the sum of the squared distance between coordinates
City Block or Manhattan Distance • G1= [1.2 4.0 5.0 1.0] • G2= [2.0 2.5 5.5 6.0] • G3= [4.5 3.0 2.5 1.0] • G4= [3.5 1.5 1.2 1.5] • Distance is the sum of the absolute value between coordinates
Correlation Distance • Pearson correlation measures the degree of linear relationship between variables, [-1,1] • Distance is 1-(pearson correlation), range of [0,2]
Similarity Measurements • Pearson Correlation Two profiles (vectors) and +1 Pearson Correlation – 1
Similarity Measurements • Cosine Correlation +1 Cosine Correlation – 1
Hierarchical Clustering • IDEA: Iteratively combines genes into groups based on similar patterns of observed expression • By combining genes with genes OR genes with groups algorithm produces a dendrogram of the hierarchy of relationships. • Display the data as a heatmap and dendrogram • Cluster genes, samples or both (HCL-1)
Hierarchical Clustering Venn Diagram of Clustered Data Dendrogram
Hierarchical clustering • Merging (agglomerative): start with every measurement as a separate cluster then combine • Splitting: make one large cluster, then split up into smaller pieces • What is the distance between two clusters?
Distance between clusters • Single-link: distance is the shortest distance from any member of one cluster to any member of the other cluster • Complete link: distance is the longest distance from any member of one cluster to any member of the other cluster • Average: Distance between the average of all points in each cluster • Ward: minimizes the sum of squares of any two clusters
Hierarchical Clustering-Merging • Euclidean distance • Average linking Distance between clusters when combined Gene expression time series
Manhattan Distance Distance between clusters when combined • Average linking Gene expression time series
Data Standardization • Data points are normalized with respect to mean and variance, “sphering” the data • After sphering, Euclidean and correlation distance are equivalent • Standardization makes sense if you are not interested in the size of the effects, but in the effect itself • Results are misleading for noisy data
Distance Comments • Every clustering method is based SOLELY on the measure of distance or similarity • E.G. Correlation: measures linear association between two genes • What if data are not properly transformed? • What about outliers? • What about saturation effects? • Even good data can be ruined with the wrong choice of distance metric
A B C D Hierarchical Clustering Initial Data Items Distance Matrix
A B C D Hierarchical Clustering Initial Data Items Distance Matrix
A B C D Hierarchical Clustering Single Linkage Current Clusters Distance Matrix 2
A B C D Hierarchical Clustering Single Linkage Current Clusters Distance Matrix
A B C D Hierarchical Clustering Single Linkage Current Clusters Distance Matrix
A B C D Hierarchical Clustering Single Linkage Current Clusters Distance Matrix 3
A B C D Hierarchical Clustering Single Linkage Current Clusters Distance Matrix
A B C D Hierarchical Clustering Single Linkage Current Clusters Distance Matrix
A B C D Hierarchical Clustering Single Linkage Current Clusters Distance Matrix 10
A B C D Hierarchical Clustering Single Linkage Final Result Distance Matrix
Gene 1 Gene 2 Gene 3 Gene 4 Gene 5 Gene 6 Gene 7 Gene 8 Hierarchical Clustering
Gene 1 Gene 2 Gene 3 Gene 4 Gene 5 Gene 6 Gene 7 Gene 8 Hierarchical Clustering
Gene 1 Gene 2 Gene 3 Gene 4 Gene 5 Gene 6 Gene 7 Gene 8 Hierarchical Clustering
Gene 1 Gene 2 Gene 3 Gene 4 Gene 5 Gene 6 Gene 7 Gene 8 Hierarchical Clustering
Gene 1 Gene 2 Gene 3 Gene 4 Gene 5 Gene 6 Gene 7 Gene 8 Hierarchical Clustering
Gene 1 Gene 2 Gene 3 Gene 4 Gene 5 Gene 6 Gene 7 Gene 8 Hierarchical Clustering
Gene 1 Gene 2 Gene 3 Gene 4 Gene 5 Gene 6 Gene 7 Gene 8 Hierarchical Clustering
Gene 1 Gene 2 Gene 3 Gene 4 Gene 5 Gene 6 Gene 7 Gene 8 Hierarchical Clustering
Hierarchical Clustering Samples Genes The Leaf Ordering Problem: • Find ‘optimal’ layout of branches for a given dendrogram architecture • 2N-1 possible orderings of the branches • For a small microarray dataset of 500 genes, there are 1.6*E150 branch configurations
Hierarchical Clustering The Leaf Ordering Problem:
Hierarchical Clustering • Pros: • Commonly used algorithm • Simple and quick to calculate • Cons: • Real genes probably do not have a hierarchical organization
Using Hierarchical Clustering • Choose what samples and genes to use in your analysis • Choose similarity/distance metric • Choose clustering direction • Choose linkage method • Calculate the dendrogram • Choose height/number of clusters for interpretation • Assess results • Interpret cluster structure
Choose what samples/genes to include • Very important step • Do you want to include housekeeping genes or genes that didn’t change in your results? • How do you handle replicates from the same sample? • Noisy samples? • Dendrogram is a mess if everything is included in large datasets • Gene screening