Download
1 / 18
180 likes | 251 Views
This study focuses on the search for f0(980) resonance decay into pp̅ final states with a photon at large angles. The analysis includes efficiency assessments, fitting function revisions, and extraction of signal components from data samples of various years. The comparison with Monte Carlo simulations reveals differences in efficiency and background corrections necessary for accurate results.

E N D
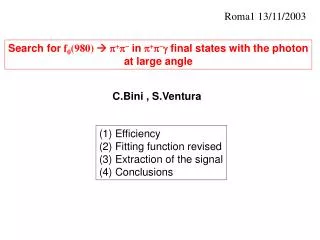
Roma1 13/11/2003 Search for f0(980) p+p-inp+p-gfinal states with the photon at large angle C.Bini , S.Ventura (1) Efficiency (2) Fitting function revised (3) Extraction of the signal (4) Conclusions
The data sample: Events with: 2 tracks from I.R. 1 photon at q > 45o M(p+p-) spectrum f0 signal Red = 2001 data Blue = 2002 data Normalized to luminosity
FILFO efficiency: from afilfo stream 7 pb-1 2001 data (19057-21889) dependence on mach. bck to check Cosmic Veto efficiency: from 2001 and 2002 full data samples (compatible) M(pp) (MeV)
Pion identification efficiency Method: Control sample of p+p-p0; Kinematic selection only; Evaluate: Prob( track calorimeter AND likelihood pion ) as function of pt and q comparison p+ vs p- Data sample: ~2 pb-1 from 2001 sample ~2 pb-1 from 2002 sample Comparison with MC: differences up to ~5% (MC has lower efficiency) 40<q<50 50<q<60 60<q<70 70<q<90
Total efficiency: MC stream ppphvlag (ISR+FSR) Sample size ~~ data sample size All selection chain apart from: Filfo Vetocos TCA+Likelihood (taken from data) Corrections from: tracking efficiency photon efficiency e(Mpp) polynomial parametrisation Vetocos effect acceptance loss photon requirement
Fitting function ISR + FSR + f0 + interf(f0,FSR). Background (ISR and FSR): Achasov et al. parametrisation + corrections based on EVA MC due to the “collinear radiation” The function depends on: M( r0 ), G( r0 ), M( w ), G( w ), M( r’ ), G( r’ ) a , b ISR FSR Signal Shape: Found a “bug” [extra 1/G] in the interf. Term now Achasov curves are well reproduced p0p0g analysis curves also reproduced Comparison function vs Geanfi: ok ( if same parameters )
Data vs. expected background: • Absolute comparison of data spectrum • with the expected background • Background parameters from: • Aleph 1997 • CMD-2 2001 • KLOE (s.a.) 2001 • No additional parameter • The accuracy on b is too poor to • allow an absolute subtraction • A fit is needed including some background parameters as free parameters (or take parameters from small angle analysis) Aleph b = -0.087 : -0.101 CMD-2 b = -0.065 : -0.075
The fit 7 free parameters: BCK: M( r0 ), G( r0 ), a , b signal: g2f0KK/4p , R , M(f0) 3 interference schemes: +, no, - Fit with interf. + c2 =765 / 483 d.o.f. Fit with no interf. c2 =688 / 483 d.o.f.
Fit results Fit with interf. - c2 =780 / 483 d.o.f. • Best fit = No int: better c2 better parameters (PDG M(f0)=980 10)
Why the c2 are too large ? Comparison between subtracted spectra Plot of the residuals for the best fit (No Int) A residual “oscillation” can be due to: efficiency background parametrization The effect is “small” ~ 1% The shape of the subtracted spectrum is ~ independent on the background parameters
Comparison of KLOE results on p+p- and p0p0 At “first view” the 2 analyses give not consistent results: (1) Same line-shape expected but: p+p-g narrow peak p0p0g very broad tail different parameters; (2) BR is ~ 50% than expected; p0p0g Fit-no s Comparison of parameters: preliminary estimates p0p0g Fit - s Solid = f0 p+p- spectrum Dashed = f0 p0p0spectrum (KLOE published) Dotted = f0 p0p0 spectrum x 2
Upper limit on h p+p- P and CP violating decay: CP(in)=- ; CP(out)=+ Standard Model prediction BR ~ 10-27 10-24 (Shabalin DPH 1995) No peak found at h mass Rough estimate of an upper limit: L = 350 pb-1 s(f) x BR(f hg) = 40000 pb e(total) = 30% x 60% BR < 2. x 10-5 PDG: < 3.3 x 10⁻⁴ (CMD-2) Expected signal shape: Centered at 547.3 Width = 1.5 MeV
Conclusions We have “refined” our efficiency evaluation found and fixed few “bugs” in the fitting function The fit now works quite well and indicates: best fit for no interference a narrow f0 peak [ G(f0 p+p-) = 47 MeV ] a large value of R (>7) [ f0 strongly coupled to kaons] BR = 1x10⁻⁴ Significant “unconsistency” with p0p0g analysis To do still: some more checks on efficiency; refinements of the fit (understand residual plot); estimate of uncertainties (dominated by the subtraction of the background) A Memo is “almost ready”
solid: f0 with NO int dashed: f0 if – int dotted: f0 if + int
CMD_2 has studied the charged channel f0 p+p- With a sample of 9.24 pb-1 at the f pick ds/dEg spectrum Cross-section versus E.c.m