Download

1 / 10
100 likes | 187 Views
Aggregate Supply. Aggregate Supply. The quantity of output that firms are willing and able to produce for the economy In the long run, the level of output depends on the capital stock, the labor force, and the level of technology.

E N D
Aggregate Supply • The quantity of output that firms are willing and able to produce for the economy • In the long run, the level of output depends on the capital stock, the labor force, and the level of technology. • The long run – a period in which nominal wages (and other resource prices) match changes in the price level • In the short run, the level of output depends on the amount of labor employed with a given level of capital and technology. • The short run – a period in which nominal wages (and other resource prices) do not respond to price-level changes.
Long Run Aggregate Supply • Aggregate supply – the total supply of all goods and services in the economy. • Aggregate supply curve shows the relationship between total quantity of output supplied by all firms and the overall price level. • The Aggregate Supply curve is NOT the sum of individual firm supply curves • In Microeconomics, a firm’s supply curve is derived by changing price and holding all other variables constant, including costs. • If there is an increase in overall price level, it is unrealistic to assume that costs are constant for individual firms
Aggregate Supply • The Aggregate Supply curve is the relationship between production and the price level; it is sometimes call a • Price-Output Adjustment Curve • The Aggregate Supply Curve, or real GDP, depends on the quantity of labor, the quantity of capital and the level of technology • In the short run, the capital and the level of technology are fixed. • Only the quantity of labor changes
Aggregate Supply • A short-run aggregate supply (SRAS) curve assumes the money wage, resource prices and potential GDP are constant. • With the money wage, resource prices and potential GDP constant, as the overall price level rises, firms will produce more output • The short-run aggregate supply curve can be shaped as a horizontal line, a vertical line or a positively sloped line. • We usually draw the aggregate supply curve as positively sloped.
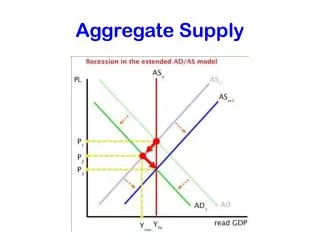
Aggregate Supply • The long-run aggregate supply curve is vertical at full employment or potential GDP. • If there is an increase in the overall price level that is matched by equal percentage increases in the money wage rate and other resource prices, the economy will remain at potential GDP. • Following adjustments, the SRAS and Aggregate Demand curves intersect along the LRAS curve.
Aggregate Supply • The SRAS will change (a shift in the curve) if the potential GDP changes, or if money wages or other resource prices change. • Changes in potential GDP can occur if there is a change in the • full-employment quantity of labor • A change in the Quantity of capital • Or a technological advance • A decrease in money-wage rates shifts the SRAS but not the LRAS because a change in the money-wage rate is matched by an equal change in the price level in the long run.
Shifts in Short-Run Aggregate Supply • Examples of shifts in SRAS • An increase in labor productivity will shift the SRAS to the right. (productivity is a measure of the relationship between a nation’s level of real output and the amount of resources used to produce that output). • An increase in the average wage rate will shift SRAS to the left. • Decreases in wages reduce per-unit production costs, so the AS curve shifts to the right • Input prices (these resources can be either domestic or imported) • An increase in technology will shift SRAS to the right • Legal-Institutional Environment – • changes in taxes and subsidies • change sin the extent of regulation.
Aggregate Supply • The horizontal portion of the AS curve represents unused capacity. • This means that the supply can increase without increasing the price. • This can only occur when there is excess capacity in terms of raw materials or labor
Aggregate Supply • The mid-range (or positive sloping range) of the AS curve illustrates a tightening of resource availability and therefore impacts the price level as more products are demanded. • This situation occurs when demand for the product increases and resources needed to produce more products are becoming scarce, and therefore more costly • The vertical range of the AS curve represents the situation where all resources are being used and no more products can be produced. • The only thing that can happen is that the suppliers raise their prices