Download
1 / 20
200 likes | 340 Views
Lecture 2: The Changing U.S. Retirement Landscape. Monday, August 28 2006. By the end of this lecture, you should be able to:. Explain why retirement income has become major issue in private and public sector Describe current sources of income for the elderly

E N D
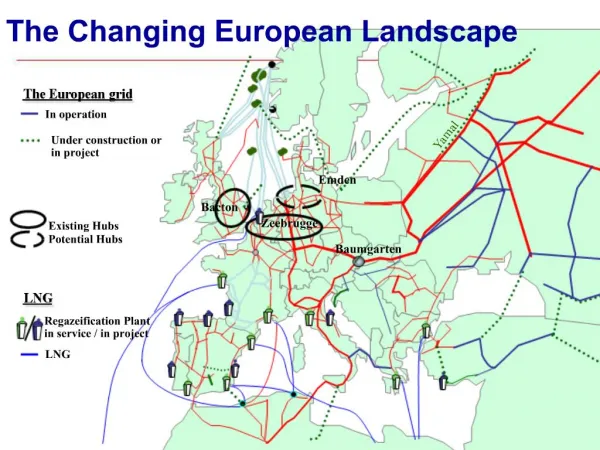
Lecture 2: The Changing U.S. Retirement Landscape Monday, August 28 2006
By the end of this lecture, you should be able to: • Explain why retirement income has become major issue in private and public sector • Describe current sources of income for the elderly • Describe major trends facing retirement landscape in the US • Discuss rationale for public concern over pensions • Explain why employers might offer pensions out of self-interest
Demographic Shifts • Life expectancy (at birth) • 1900: male = 51.5, female = 58.3 • 2000: male = 79.6, female = 84.3 • Fertility declines • Work patterns • In 1900, 2/3 of those who reached 65 continued working • Today, only 1/8 continue working after 65 • Living arrangements • Nearly 3 out of 4 retired men in 1900 lived with adult children • Today, fewer than 1 in 5 do
Source: Fast Facts & Figures about Social Security, August 2004
Social Security Act of 1935 • Social Security as a national retirement system • Championed by FDR to offer “some measure of protection to the average citizen and to his family … against poverty ridden old age” • Backdrop: high unemployment (25% in 1932) and stock market crash of 1929
Social Security Today • In 2005, more than 48 million Americans will receive approx. $518 billion in benefits • Approx 40 million of these are retirees, or their dependents and survivors (rest is for DI) • More than 9 of every 10 individuals over age 65 receive SS benefits • About 2/3 of elderly receive 50% or more of their income from Social Security • SS is the only source of income for 22% of elderly
Employer Sponsored Pensions • Largely gained popularity in post WWII period – often driven by unionization • Savings accumulated in employer plans is growing fast • $1.6 trillion in 1985 • $5.5 trillion in 2003 • Pronounced shift away from defined benefit to defined contribution plans • Much more to come on this topic!
Individual Savings • Accounts for 15% of all retirement income, but is highly skewed • More than half of households report income from assets, but many have none • Line between personal saving and pension saving is getting increasingly blurry
Labor Earnings • In 1962, 36% of households age 55+ received labor earnings • In 2002, only 22% do • Choosing retirement date is an important adjustment mechanism for those who have over- or under-saved • Ability to contribute to workforce much greater today • Better health than elderly of 50 years ago • Job skills not as tied to physical prowess
Public Assistance • Programs such as SSI (Supplemental Security Income) • 5% of elderly households receive some form of public assistance • For 25% of recipients, it is sole source of income
What are the Big Trends? • Continued aging of the population • Shift towards more “self reliance” • DB to DC • Debate over personal accounts • Rising health care costs
Population Aging • Ratio of individuals age 20 – 64 to individuals age 65+ • 1950: >7 • 1975: 5.3 • 2000: 4.8 • 2025: 3.3 • Today, 1 in 8 citizens is age 65+ • By 2050, 1 in 5 will be age 65+
DB vs. DC Plans • Defined Benefit • Defined Contribution
The Shift from DB to DC • 1980: 38 million DB participant 20 million DC participants • 1999: 41 million DB participants 60 million DC participants Source: U.S. DOL Private Pension Plan Bulletin
Health Care • U.S. spent 14.1% of GDP on health care in 2001, or about $1.4 trillion • Up from 8.8% of GDP in 1980 • Likely to reach 16% by 2010 • Growth in costs expected to accelerate – some estimates that it will be 38% of GDP in the long-run!!! • Disproportionately large fraction of health care expenditures incurred by the elderly
A Model of Individual Retirement Savings Behavior • The “Life Cycle Model” • Individuals like to smooth consumption over their lifetime • But income is not even over lifetime • What do you do?
A Simplified Life Cycle Model $ Income save Consumption borrow Spend down wealth Age 62 Age 22 death
The “Rational” Case Against Public and Private Pensions • If individuals were behaving rationally and with perfect foresight, they should be saving enough today to take care of their retirement • Attempts to force savings through public or private pensions will be: • At best, redundant and unnecessary • At worst, harmful, by making people save too much, etc.
The Case for Public Support of Retirement Pensions • Inadequate foresight or planning • Uncertainty and imperfect insurance markets • How long will I live? • What will my expenditure needs be? • Income Redistribution
The Value of Pensions to Employers • Tax deferral • The three Rs • Recruiting • May help “sort” out type of applicant that you want • Retention • Vesting rules, back-loaded compensation plans • Retirement • Influence choice of retirement date • Encourage Productivity • Discourage collective bargaining