Understanding Spatial Data Types and Storage in MATLAB: A Guide to Vector and Raster Data
This guide explores fundamental concepts of spatial data types and their storage methods in MATLAB. We delve into vector data for creating polygons and outlines, and raster data represented as 2D arrays for various applications, such as elevation or rainfall mapping. We discuss different data formats (GIF, BMP, TIFF, JPEG, PDF), their features, and compatibility issues. Additionally, we cover importing and processing images using MATLAB, including converting color images to grayscale, and provide practical instructions for managing spatial data files.


Understanding Spatial Data Types and Storage in MATLAB: A Guide to Vector and Raster Data
E N D
Presentation Transcript
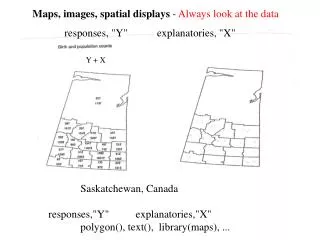
Data types and storage: • Vector data- making polygons, outlines, like coastline
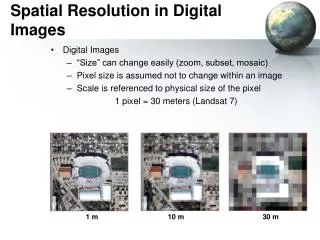
Data types and storage: • Raster data, 2D arrays, gridded data • Color, or rainfall, or elevation
Raster data storage • 2d data • Computer stores data as bits (ones and zeros) • 1-bit array Ex: (1=white, 0=black) • More complex data: eight bits=byte • 1 byte=28=256 possibilities => gray scale with 256 intensities of black to white, or 256 values of a colorscale (use colormaps) • Still not good enough for good maps… • 24-bit system; 8 bits for each RGB channel=2563=16,777,216 colors • 24 bit storage requires lots of memory!!!
Data formats: • Compuserve Graphics Interchange Format (GIF): • 256 colors, Compression without data loss-Designed for fast transfer over the internet, Good for line art, simple maps, cartoons, logos • Microsoft Windows Bitmap Format (BMP) • Native bitmap format for Windows OS,Converters exist to read and write BMP files on other platforms • Tagged Image File Format (TIFF) • Includes an image file header, a drectory, and the data in all available graphics and image file formats;Vector and raster versions;Designed to be very portable- any computer platform • BUT, evolution caused incompatibilites…Thousands of Incompatible File Formats • PICT • Apple;Rasters and vectors;PICT not supported by other platforms
Data formats, con’t: • PostScript (PS) Encapsulated PostScript (EPS) • Xerox/ Aldus (Adobe)/Apple; Vector format • PS-generally single-page format, illustration of a text • EPS- included in other pages, contain combination of text, graphics, and images • Joint Photographic Experts Group (JPEG) • Image compression and format;Irreversible compression (data lost);Three channel- 24 bit true color • Portable Document Format (PDF) • Adobe;Cross-platform;Contains complete formatting of vector illustrations, raster images, and text; Highly compressed;Fast internet download
Importing, Processing, Exporting Imageslab activity: • http://asterweb.jpl.nasa.gov/gallerymap.asp • Make new directory in your matlab space • Download and save image
Importing, Processing, Exporting Images, con’t • On command line ….( pg 231) • Picture1=imread(‘name of image.jpg’); • imshow (Picture1); • PictureGray=rgb2gray (Picture1); • imshow (Picture1), figure, imshow(PictureGray); • Follow remaining instruction on pg 233-235 • NOTE there is a TYPO in Book: iminfo(‘PictureGray.jpg’); • To hand in: the 3 images (rgb, grayscale, and indexed rgb)
Spatial Data • Raster data: Digital Elevation maps • ETOPO1: 1 arc minute resolution • GTOPO30: 30 arc seconds (~1 km) resolution • Shuttle Radar Topography Mission (SRTM) 30, 90 m res.
Spatial Data • Raster data: ETOPO1 • http://www.ngdc.noaa.gov/mgg/fliers/01mgg04.html • Custom grids- ngdc • Your grid ID: you pick a name, likemygrid01 • Grid databas: ETOPO1 • Latitude 30 E 60E Longitude20N 20 S • Grid Cell size 1 min • Grid Format ASCII raster • SUBMIT • w/software, w/ geography, w/coastline • Compress and retrieve • …wait while it processes…. • Retrieve • …wait while it downloads…. • Save your data in a folder that matlab sees • decompress (unzip)
Spatial Data, con’t • Let’s look at the data and header info • On command line of terminal window type • !head MyGrid01.asc (or whateer the name of your data) • You are now viewing the first few lines of the data that you imported • You want to plot the data, so you have to remove the header info from your data file: NewMyGrid=dlmread(‘MyGrid.asc’,’’,6,0); • Now save your new data file save newMyGrid.matNewMyGrid • Now follow the directions from page 169-171 • With the same data, modify script on page 172