Download
1 / 13
140 likes | 330 Views
Texas Drought Assessment and Forecasting . David R. Maidment Center for Research in Water Resources University of Texas at Austin. Water Web Services Jamboree University of Texas at Austin 20 March 2012. Electric Reliability Council of Texas (ERCOT). http://www.ercot.com/news/mediakit/maps/.

E N D
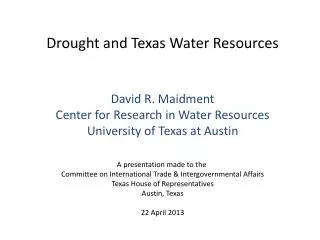
Texas Drought Assessment and Forecasting David R. MaidmentCenter for Research in Water ResourcesUniversity of Texas at Austin Water Web Services JamboreeUniversity of Texas at Austin 20 March 2012
Electric Reliability Council of Texas (ERCOT) http://www.ercot.com/news/mediakit/maps/
Standardized Precipitation Index (SPI) Source: John Neilsen-Gammon, Texas A&M University
Weekly Change in SPI Source: John Neilsen-Gammon, Texas A&M University
(Byron Tapley, UT Center for Space Research) Source: http://www.jsg.utexas.edu/ciess/files/Water_Forum_01_Tapley.pdf
Ensemble Streamflow Simulations for 2012Produced by National Weather Service, distributed by University of Texas at Austin and Kisters • 348 forecast points • Including reservoir inflows • 11 basins • Based on weather 1959-2009 • 50 scenarios of daily flows for each point generated from an NWS rainfall-runoff model (with reservoirs included) • 90+ days horizon from today (to end of summer) • Updated weekly Basins
Overlay Plot of 2010, 2011, 2012 for Jan to December Colorado River at Austin Dec July Jan
Overlay Plot of 2010, 2011, 2012 for Jan to May Colorado River at Austin May March Jan
5%, 95%, Normal, and Observed Discharge, 2007 – 2012 Colorado River at Austin
Accumulated Inflow, 2007 – 2012Highland Lake System 30 year normal lake accumulation actual lake accumulation