Download
1 / 22
220 likes | 334 Views
The Ecological Footprint Accounting Tool offers a comprehensive method to evaluate the balance between human resource demand and the Earth's regenerative capacity. It measures how much biosphere resources are consumed versus how much can be sustainably provided. By assessing various factors, including soil, water, and energy consumption, this tool highlights the limits of Earth's biocapacity and the pressing risks of overexploitation. Understanding and applying these metrics can aid in promoting sustainability and mitigating environmental degradation for a healthier planet.

E N D
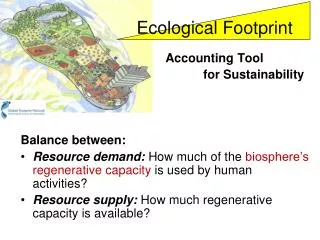
Ecological Footprint Accounting Tool for Sustainability Balance between: • Resource demand: How much of the biosphere’s regenerative capacity is used by human activities? • Resource supply: How much regenerative capacity is available?
‘Biosphere regenerative capacity’ • Capacity of soil, water, plants, animals, micro-organisms to provide resources without being exhausted. • EG soil to grow food without eroding/losing fertility, forests to regrow after felling, fish stocks to build up after harvesting • EG surface and groundwater to provide drinking, industry, crop irrigation etc supply • Capacity for vegetation to absorb CO2, water to break down pollutants to harmless substances
Energy assumed to be the biggest problem • Climate change associated with rising GHGs assumed to be the biggest current threat to biosphere regenerative capacity • Energy production and consumption given greatest weighting • ‘Carbon footprint’ focuses solely on GHG emissions [not covered here]
Overhang assumption We can use biosphere resources eg fish, timber, soil, water, oil, gas etc faster than: (1) they can regenerate, (2) our waste products can be assimilated [ie not accumulate in toxic/damaging concentrations in air, water, on land]. But only for while.. Eventually either they run out, or we pollute our planet with very bad consequences for our wellbeing
Ecological Footprint • We measure the mutually exclusive types of areas necessary to produce the resources we consume and absorb the waste we produce. • The unit is a global hectare [gha] (10 000 m²), with the average productivity of the world’s bio-productive surface (ocean and land). Assumes everybody on Earth is entitled to equal share of global resources
Footprint components Ecological Footprint Fossilenergie verbaute Abfall Nahrung Holz und Faser Fläche Fossil Fuel Built-up Waste Food Fibres, Firewood absorption W.Pekny, Plattform Footprint
Ecological Footprint • Non renewable fossil fuels impacts are calculated with the area necessary to absorb the emitted CO2 (forest and oceans). • Note each piece of land is assumed to have only one effect. Eg forest land to absorb carbon dioxide does not also provide timber, fish etc • Many methodological issues arise
Biocapacity 67% Oceans with low productivity 22% Bioproductive segments 4% Oceans with high productivity 13.4 B hectares 18% productive land 11% Deserts, ice
Ecological Footprint • The very complex ecological inter-relations are summarized to simple parameter: area. • The strength of the concept is the obvious and indisputable limit of area on planet Earth. • No matter how much money, houses, industries we have, we need biocapacity to survive
Ecological Footprint Footprint The only sustainability metric with an undisputable maximum value: one Earth. 13.4B ha bio productive area
Assuming a fair allocation of area, there is about 1.8 gha available per person today (not including any area for biodiversity) • The average European citizen requires 4.8 gha to meet his/her material demands. (US citizen 9.6 gha)
For all people to live like Europeans would require 2.5 planets
Human Ecological Footprint, 1950-2050 Standard scenario Sustainable scenario Absolute Limits + 40% in 2008 Humankind uses an equivalent of 1.4 Earths We no longer get along with the interest Earth provides. We use the capital stocks. Source: Ecological Footprint of Europe WWF 2008
Human Ecological Footprint, 1950-2050 Standard scenario Sustainable scenario Absolute Limits By 2050, the ecological debts would equal about 34 years of planetary production Source: GFN Daten update 2008
National Footprints Figures in gha/capita Ireland tenth Built land Fishing Forest Pasture Arable land Carbon Footprint A Switzerland D Austria Slovenia China Germany Hungary World available WWF Living Planet Report 2008
National Footprints figures in gha/capita China 1330 Nigeria 130 Indonesia 223 India 1100 Pakistan 158 Bangladesh 142 WWF Living Planet Report 2008
Product Footprints National Footprint Component Footprint Aggregated Footprint per capita • Top Down • Regional Footprints • City Footprints • Individual Footprint • Bottom Up • Energy Footprint • Transport Footprint • Carbon Footprint
Summary 1 • In relation to region/Earth’s capacity to provide us with energy, food, living space, assimilate wastes, can measure whether we are using resources faster than are being renewed • gha unit: big success, many organisations, countries, companies have adopted it as key indicator for measuring sustainability • Raising general awareness: many people believe they understand what the EF measures
Summary 2 Socio-economics not included Toxic substances not included One aggregated figure: not much use for prioritising policies Awareness/behaviour divide
What EF can do for us… • Measure resource demand and supply. • Show us where we are using resources too quickly. • Highlight which land type is used most intensively. • Provides a basis for comparing overall resource demand amongst settlements, regions and countries. • Provides a personal account of the resource demand of an individual’s lifestyle.
What EF cannot do for us… • Show us why we are using resources too quickly. • Help with finding policies to reduce our consumption [other than the general policy: ‘we must use less’]. • Take account of other impacts on the environment eg mercury pollution, ozone depletion [ie it UNDERESTIMATES our overall impact on the Earth]. • Tell us about the impact of resource consumption on human health and wellbeing.
Take this quiz to estimate your Ecological Footprintwww.footprintnetwork.org/en/index.php/GFN/.../calculators/ORSearch words: calculate your ecological footprint