Understanding Linear Models: Slope and Intercept in Bivariate Data Analysis
This lesson introduces students to the use of linear models in analyzing bivariate data. Students will learn to solve problems using linear equations and interpret the significance of the slope and y-intercept. Through guided practice involving real-world data, students will explore how to draw a line of best fit and assess model accuracy by evaluating the closeness of data points to the line. Key concepts such as correlation, positive and negative relationships, and prediction will be covered, enhancing their mathematical modeling skills.

Understanding Linear Models: Slope and Intercept in Bivariate Data Analysis
E N D
Presentation Transcript
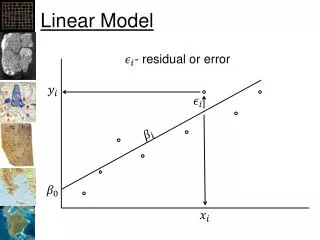
Linear Statistical Model MAFS.8.SP.1.3: Use the equation of a linear model to solve problems in the context of bivariate measurement data, interpreting the slope and intercept.
Mathematics Practices • MP.4 Model with mathematics. Students model relationships between variables using linear and nonlinear functions. They interpret models in the context of the data and reflect on whether or not the models make sense based on slopes, initial values, or the fit to the data. • MP.6 Attend to precision. Students evaluate functions to model a relationship between numerical variables. They evaluate the function by assessing the closeness of the data points to the line. They use care in interpreting the slope and the 𝑦-intercept in linear functions. • MP.7 Look for and make use of structure. Students identify pattern or structure in scatter plots. They fit lines to data displayed in a scatter plot and determine the equations of lines based on points or the slope and initial value.
Essential Questions • How can I use equation models to solve statistics problems? • How can I interpret the slope and intercept of a data set?
Bell-Ringer • What is correlation? • When one event causes another. • Plotted points • The description of the relationship between two variables. • None of the above • What is a line of best fit? • A break line that is vertical on the graph. • The x-axis line of the data. • An equation that predicts the y variable. • None of the above • What does it mean to make a prediction? Write your answer.
Vocabulary Bivariate data In statistics, bivariate data is data that has two variables. The quantities from these two variables are often represented using a scatter plot. This is done so that the relationship (if any) between the variables is easily seen. Positive Correlation Is when the variables of the data increases together; the correlation coefficient is between 0 and +1. Negative Correlation Is when one variable decreases as the other increases.
Guided Practice • The 2014 NBA Championship Series featured the San Antonio Spurs versus the Miami Heat. The following graph compares the number of minutes each team’s starters played in game one of the championship series compared with the number of points he scored during the game.
Guided Practice- Line of Best Fitcontinued • Is there a correlation between the number of minutes played and the total number of points scored? Explain your answer. • Draw what you think is the best fit line.
Guided Practice - continuesEquation of the Line of Best Fit • What is the equation of the best fit line? • What does the slope of the best fit line tells you about the data?
Guided Practicecontinued • What is the intercept of the data set? • Should we expect a player that played 45 minutes to score more than 10 points? Justify your answer.
Check your progress The table below shows the test scores for individual students and the number of minutes that student spent studying for the test. Construct a scatter plot of the data. Then draw a line that seems to best represent the data.
Check your progress • Sketch a line of best fit through your scatter plot. • Find the equation of the line of best fit. • What does the slope of the best fit line tell you about the data? • What, if anything, does the y-intercept tell you about the data? • Use the line of best fit to predict the test score for a student who studied 25 minutes.
What is the equation of the best fit line? y = 0.5061x + 70.464 The equation that we wrote is in slope – intercept form… y Study Time Vs. Test Scores 110 100 b represents the y-intercept 90 Test Scores 80 m represents the slope 70 60 Is the slope positive, negative, or zero? x 0 10 20 30 40 50 60 positive Study Time (Minutes)
Study Time Vs. Test ScoresCalculations Step 1: Find the slope of the best fit line • Select two points on the best fit line (X1,Y1) and (X2,Y2) • For example (40,91) and (15,76) • Use the slope formula to find the slope M = - - M = 91 – 76 = 15 = 0.6 40 – 15 25 • Show the students step by how to draw the best fit line, write the equation, make a prediction, etc.
Study Time Vs. Test ScoresCalculations Step 2: Find the y-intercept of the best fit line. • Extend the best fit line to see where it crosses the y-axis.
Study Time Vs. Test ScoresCalculations y Study Time Vs. Test Scores • Step 2: Find the y-intercept of the best fit line. • Extend the best fit line to see where it crosses the y-axis. • The y-intercept is 70. 110 100 90 Test Scores 80 70 60 x 0 10 20 30 40 50 60 Study Time (Minutes)
Study Time Vs. Test ScoresCalculations Step 3: Find the equation of the best fit line • Using the slope and y-intercept of the best fit line to find the equation in slope intercept form. • y = mx + b Where slope, m = 0.6 and y-intercept, b = 70 • y = 0.6x + 70 • Show the students step by how to draw the best fit line, write the equation, make a prediction, etc.
Independent Classwork Part A: Organize into groups of six students. Using a tape measure, measure and record each group member’s height and arm length. Using the collected data, create a scatter plot comparing height and arm length. Sketch an approximate of the best fit line. Find the slope of the best fit line. Answer the questions attached to this worksheet. Questions: 1. What was the slope of the best fit line? 2. In terms of data (arm length and height), explain what the slope means. 3. In terms of arm length and height, what does the best fit line tell you? 4. What do you notice about the relationship between arm length and height?.
Independent Classworkcontinues • Part B: • Input the data into Excel Spreadsheet, Geogebra software, or a graphing calculator. Using the software: • Create a scatterplot • Find the line of best fit • Create a regression line and display the line of best fit • Display the equation of the line. • Compare your results with the line of best fit that you created.
Closure • Administer the Summative assessment of the content covered. • Assign homework to re-enforce the content covered.