Check Image Collaborative Report Highlights
Detailed report on check image exchange implementation and volume trends in the industry. Key messages on transactions settled through Federal Reserve and more.

Check Image Collaborative Report Highlights
E N D
Presentation Transcript
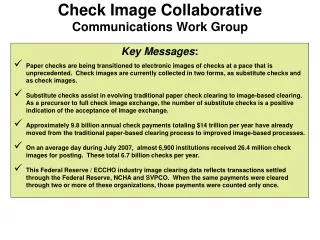
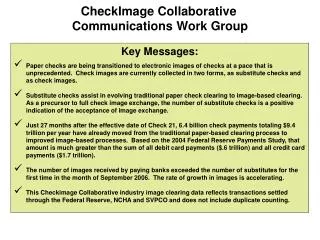
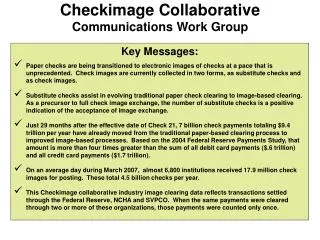
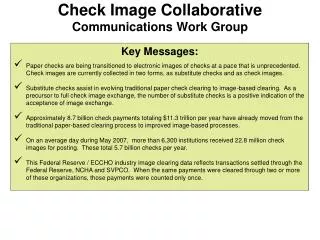
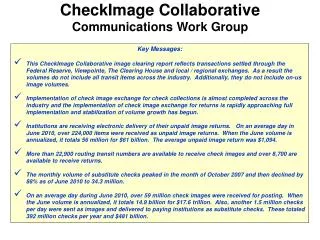
CheckImage Collaborative Communications Work Group • Key Messages: • This CheckImage Collaborative image clearing report reflects transactions settled through the Federal Reserve, Viewpointe, The Clearing House and local / regional exchanges. As a result the volumes do not include all transit items across the industry. Additionally, they do not include on-us image volumes. • Implementation of check image exchange for check collections is almost completed across the industry and the implementation of check image exchange for returns is rapidly approaching full implementation and stabilization of volume growth has begun. • Institutions are receiving electronic delivery of their unpaid image returns. On an average day in June 2010, over 224,000 items were received as unpaid image returns. When the June volume is annualized, it totals 56 million for $61 billion. The average unpaid image return was $1,094. • More than 22,900 routing transit numbers are available to receive check images and over 8,700 are available to receive returns. • The monthly volume of substitute checks peaked in the month of October 2007 and then declined by 88% as of June 2010 to 34.3 million. • On an average day during June 2010, over 59 million check images were received for posting. When the June volume is annualized, it totals 14.9 billion for $17.6 trillion. Also, another 1.5 million checks per day were sent as images and delivered to paying institutions as substitute checks. These totaled 392 million checks per year and $481 billion.
Highlights: Chart reflects volume received by DFIs for payment from other DFIs or an intermediary. Average daily image volume grew from 40.70 to 59.31 million from July 2008 to June 2010. June 2010 volume annualized is 14.9 billion images received per year. Average # of Images Received /Day # Items in Millions Data Sources: Transactions settled through the Federal Reserve, Viewpointe, The Clearing House and other local / regional exchanges Jul-09 Jul-08 Jan-09 Mar-09 Jan-10 Sep-09 Mar-10 Sep-08 May-09 Nov-09 Jun-10 Nov-08
R/Ts Available Highlights: Chart reflects the number of R/Ts available to receive images from other DFIs or an intermediary. Number of image-available receiving R/Ts grew from 15,583 to 22,950 from July 2008 to June 2010. To Receive Images # of Image-Available R/Ts Data Sources: Transactions settled through the Federal Reserve, Viewpointe, The Clearing House and other local / regional exchanges Jul-08 Jul-09 Jan-10 Jan-09 Sep-08 Nov-09 Mar-09 Sep-09 Jun-10 Nov-08 May-10 May-09
Highlights: All checks were imaged before reconversion to substitute checks. Chart reflects checks received by DFIs for payment from other DFIs or an intermediary. The monthly dollar amount received grew from $1.55 trillion to $1.58 trillion. Annualized June 2010 dollar amount = $18 trillion/yr. $ Amounts of Images & Substitute Checks Forward Collection Only $ Amounts in Billions Data Sources: Transactions settled through the Federal Reserve, Viewpointe, The Clearing House and other local / regional exchanges Jul-08 Jul-09 Jan-10 Jan-09 Sep-08 Nov-09 Mar-09 Sep-09 Jun-10 Nov-08 May-10 May-09
Highlights: All checks were imaged before reconversion to substitute checks. Chart reflects volume received by DFIs for payment from other DFIs or an intermediary. Over 24 month period Image-based clearing volume grew from 1,189 to 1,339 million / mo with 97% of the volume cleared by image in June 2010 (22 days in June). The annualized June ‘10 volume is 15.3 billion items/yr. # of Images & Substitute Checks Forward Collection Only # Items in Millions Images Data Sources: Transactions settled through the Federal Reserve, Viewpointe, The Clearing House and other local / regional exchanges Substitute Checks Jul-08 Jul-09 Jan-10 Jan-09 Sep-08 Nov-09 Mar-09 Sep-09 Jun-10 Nov-08 May-10 May-09
Highlights: Chart reflects the number of R/Ts available to receive unpaid image returns from other DFIs or an intermediary. From May 2009 to June 2010, the number of R/Ts available to receive unpaid image returns has more than doubled from 3,511 to 8,743 R/Ts. Number of R/Ts Available to Receive Image Returns # of R/Ts Available to Receive Returns Data Sources: Transactions settled through the Federal Reserve, Viewpointe, The Clearing House and other local / regional exchanges Jun-09 Jul-09 Oct-09 Sep-09 Jun-10 Jan-10 May-09 Aug-09 Dec-09 Feb-10 Mar-10 Apr-10 Nov-09 May-10
Highlights: This chart reports the volume trend of unpaid image returns delivered electronically to the receipt location designated by the bank of first deposit. Between January 2009 and June 2010, the volume of image returns grew by 96% from an average daily volume of 114,000 to 224,000. Average # of Image Returns/Day # Items in Thousands Data Sources: Transactions settled through the Federal Reserve, Viewpointe, The Clearing House and other local / regional exchanges Sep-09 Nov-09 Jul-09 Mar-09 Mar-10 Jan-09 Jun-10 Jan-10 May-09
Highlights: This chart reports the dollar amount trend of unpaid image returns delivered electronically to the receipt location designated by the bank of first deposit. Between January 2009 and June 2010, the dollar amount of image returns grew by 96% from $2.7 to $5.3 billion. The average dollar amount of image returns ranged from a low of $1,072 per return to a high of $1,215. $ Amount of Returns $ Amounts in Millions Data Sources: Transactions settled through the Federal Reserve, Viewpointe, The Clearing House and other local / regional exchanges Sep-09 Jul-09 Nov-09 Jan-10 Jan-09 Mar-09 Mar-10 May-09 Jun-10
Highlights: Chart reflects volume received by DFIs for payment from other DFIs or an intermediary. Average daily image volume grew from .08 to 58.91 million from Qtr 1 2005 to Qtr 2 2010. Qtr 2 2010 volume annualized is 15 billion images received per year. Average # of Images Received /Day # Items in Millions Data Sources: Transactions settled through the Federal Reserve, Viewpointe, The Clearing House and other local / regional exchanges Qtr 3 '08 Qtr 3 ‘09 Qtr 1 ‘09 Qtr 1 '05 Qtr 3 '07 Qtr 1 '08 Qtr 1 '07 Qtr 1 '06 Qtr 3 '06 Qtr 3 '05 Qtr 2 ‘10
Highlights: Chart reflects check images received by DFIs for payment from other DFIs or an intermediary. The quarterly dollar amount of images received grew from $1.7 billion to $4.4 trillion. Annualized Quarter 2 2010 dollar amount = $17.7 trillion/yr. $ Amounts of Images Received by Paying Institution $ Amounts in Billions Data Sources: Transactions settled through the Federal Reserve, Viewpointe, The Clearing House and other local / regional exchanges Qtr 3 '08 Qtr 3 ‘09 Qtr 1 ‘09 Qtr 1 '05 Qtr 3 '07 Qtr 1 '08 Qtr 1 '07 Qtr 1 '06 Qtr 3 '06 Qtr 3 '05 Qtr 2 ‘10