Download
1 / 17
170 likes | 193 Views
This research explores the social ecological models of alcohol and drug problems, examining niche selection, drinking behaviors, agent activities, and environmental opportunities. Examples include analyzing the impact of alcohol beverage prices and the minimum purchase age on alcohol use and related risks.

E N D
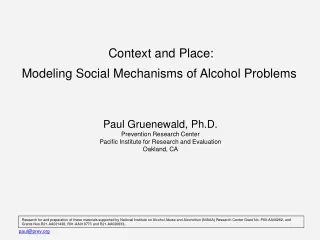
Context and Place: Modeling Social Mechanisms of Alcohol Problems Paul Gruenewald, Ph.D. Prevention Research Center Pacific Institute for Research and Evaluation Oakland, CA Research for and preparation of these materials supported by National Institute on Alcohol Abuse and Alcoholism (NIAAA) Research Center Grant No. P60-AA06282, and Grants Nos.R21-AA021438, R01-AA019773 and R21-AA020633,. paul@prev.org
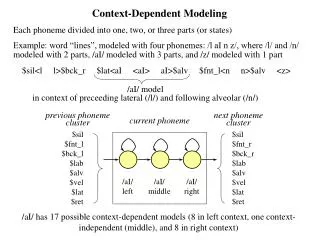
“Social Ecological Models of Alcohol and Drug Problems” I often say that this is what I study. But what is it? Niche Selection Drinking Behaviors Agent Activities Environmental Opportunities Niche Construction Analytical Sociology Computational Models of Social Behaviors Gruenewald, P.J. (2007) The spatial ecology of alcohol problems: Niche theory and assortative drinking. Addiction, 102, 870-878.
Three Examples of Where Social Ecological Analyses Can Take Us • Beverage prices and alcohol use. • Higher prices generally lead to less use. • But can higher prices lead to more use? • The minimum drinking age and youth drinking. • Lower ages generally lead to more use. • But can lower ages lead to less use and more problems? • Elucidating the ecology of heavy drinking and dependence. • Heavier drinking is generally related to diagnoses of dependence. • But why are many moderate drinkers diagnosed as dependent?
First Example: Alcohol Beverage Prices Alcohol is a “complex” good. • Gold bullion is a “simple” good with a very low price range • Alcohol is a complex good with a very large price range • Three different types (beer, wine and spirits) • Wide range of qualities • Budweiser to boutique beers • “Mad Dog 20-20” to Rutherford Estate Zinfandel • Jose Cuervo to Don Julio 1942 Tequila • Basic Idea: If prices go up then consumers can • Reduce use or . . . • Switch to a lower quality/price good. • (Systembolaget rectification of alcohol prices prior to joining the European Union.) Treno, A.J., Nephew, T.M., Ponicki, W.R. and Gruenewald, P.J. (1993) Alcohol beverage price spectra: Opportunities for substitution. Alcoholism: Clinical and Experimental Research, 17, 675-680. Gruenewald, P.J., Ponicki, W.R., Holder, H.D. and Romelsjo, A. (2006) Alcohol prices, beverage quality, and the demand for alcohol: Quality substitutions and price elasticities. Alcoholism: Clinical and Experimental Research, 30, 96-105.
First Example: Alcohol Beverage Prices Increase all prices: High Quality $25.00 High Quality $21.00 Low Quality $5.00 Low Quality $1.00 10% Price Increase -1.69%
First Example: Alcohol Beverage Prices Increase least prices: High Quality High Quality $21.00 $21.00 Low Quality $5.00 Low Quality $1.00 10% Price Increase -4.15%
First Example: Alcohol Beverage Prices High Quality $35.00 Increase high prices: High Quality $21.00 Low Quality Low Quality $1.00 $1.00 10% Price Increase +2.83%
First Example: Alcohol Beverage Prices • Moral of the story: • Producers and distributors can choose to pass on taxes through prices in many ways • In the case of complex goods, they can do so in ways that defeat the public health intent of the tax. • And a couple of questions: • Are tobacco products complex goods? • Will marijuana products become increasingly complex goods?
Second Example: The Minimum Purchase Age (MPA) • New Zealand lowered it’s minimum purchase age from 20 to 18 in the 1990s. • Generally, the impacts of the lowered MPA were as expected: • Greater use by 18-19 year olds • More use by underage 16-17 year olds • More problems • One of the primary arguments made in favor of this change was: The lowered MPA will provide young people opportunities to model safe drinking practices in commercial establishments. So . . . Did it become safer to drink alcohol in bars and restaurants? (NZ national alcohol surveys of adults and youth before and after lowered MPA.) Gruenewald, P.J., Treno, A.J., Ponicki, W.R., Huckle, T., Li-Chia, Y. and Casswell, S. (2015) Impacts of New Zealand’s lowered minimum purchase age on context-specific drinking and related risks. Addiction, 110, 1757-66.
Effects of MPA on Drinking in Contexts: 18-19 Year Olds Drinking Contexts: Annual Frequency: Typical Quantity: Annual Problems: Pubs and Nightclubs +75.9% -18.8% +214.6% Restaurants +37.8% +11.1% +4.8% Home 16-17 Year Olds: More frequent drinking at home More frequent drinking at other’s homes Greater quantities in both places More problems related to drinking Other’s Home (Problems: Fights, arguments, drinking too much, hangover, trouble at work or school.)
Second Example: The Minimum Purchase Age (MPA) • Moral of the story: • The lowered MPA led to more use and problems. • Drinking in pubs looked safer because many more lighter drinkers began to drink in those places. • Greater risks arise because these drinkers are drinking more than they normally would. • A critical question: • How much of the risks we attribute to alcohol use are due to where people drink rather than how much they drink? • (Misattribution?)
Third Example: Ecological Correlates of Dependence? • Elucidating the ecology of heavy drinking and dependence. • Heavier drinking is generally related to diagnoses of dependence. • But why are many moderate drinkers diagnosed as dependent?
Some dependence symptoms with likely ecological correlates: • Drinking larger amounts over longer times. • Will be facilitated if life activities are not in conflict with drinking. • Can be induced and maintained by peer influence. • Activities given up or reduced due to drinking. • Will be determined by the extent to which activities interfere with drinking. • Alcohol use can be better integrated with some activities than others. • Drinking despite persistent physical or psychological problems. • Persistent drinking supported and maintained by peer influence. • Persistent drinking maintained when problems can be accommodated. So there are reasons to believe that social ecological circumstances will be related to symptom reports related to dependence.
And there are good reasons to believe that the social ecological circumstances are unique to heavy drinking (Affiliation Network: Age Groups and Drinking Quantities) Home (4,4,4) Relatives (4,4,2) Restaurant (3,1,0) Friends (1,2,1) Party (0,1,2) Bar (0,2,3) 18-29 30-45 46-65 66-97 18-29 30-45 46-65 66-97 18-29 30-45 46-65 66-97 3-5 Drinks: 6-12 Drinks: 1-2 Drinks:
Changing Age-Cohort Relationships of Contexts and Heavy Drinking Average Drinking Quantities 1 – 2 Drinks: 3 – 5 Drinks: 6 – 12 Drinks: 18-29: 30-45: 46-65: 66-97: Home: 18-29: 30-45: 46-65: 66-97: Friends’ Homes: 18-29: 30-45: 46-65: 66-97: Bars: 18-29: 30-45: 46-65: 66-97: Restaurants: -75% -50% -25% 1.0 +25% +50% +75% +100% +150% +200% +250% 18-29: 30-45: 46-65: 66-97: Parties: Normalized Age-cohorts
Three Examples of Where Social Ecological Analyses Can Take Us • Beverage prices and alcohol use. • Higher prices generally lead to less use. • But higher prices can lead to more use. • The minimum drinking age and youth drinking. • Lower ages generally lead to more use. • But it can appear that there are less risks involved. • Elucidating the ecology of heavy drinking and dependence. • Heavier drinking is generally related to diagnoses of dependence. • There may be an ecological explanation as to how moderate drinkers come to be diagnosed as dependent.