Download

1 / 20
200 likes | 232 Views
Economic Impact of the Volcano Cloud Crisis Paula Leal de Matos, EUROCONTROL Belgrade, 7 September 2010. European Organisation for the Safety of Air Navigation. Contents. Contents. Traffic in Europe [1] before and during the April crisis. 104,000 flights cancelled

E N D
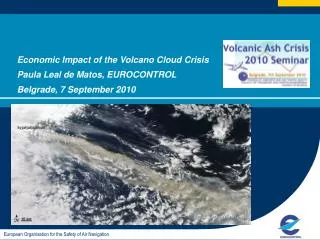
Economic Impact of the Volcano Cloud CrisisPaula Leal de Matos, EUROCONTROLBelgrade, 7 September 2010 European Organisation for the Safety of Air Navigation
Traffic in Europe[1] before and during the April crisis 104,000 flights cancelled 48% of expected traffic 8 days – peak 80% 18th April 10m PAX unable to travel Before After + 7,000 flights cancelled in May Source: EUROCONTROL/STATFOR [1] In this note, ‘Europe’ refers to the EUROCONTROL Statistical Reference Area, see www.eurocontrol.int/statfor/faq for definition.
Most affected CountriesFlights Cancelled (%) – April Source: EUROCONTROL/STATFOR
Most affected CountriesFlights Cancelled (%) – May What happened in Iceland ? In April, traffic affected for 13 days. Not quite as high as Finland as Iceland maintained flights to North America. In May, Iceland lost arrival& departures. Main effect was re-routing of North Atlantic flows to the North of the ash, which at peak increased overflight traffic by factor of 6. Source: EUROCONTROL/STATFOR
Flights Cancelled per Market Segment 15 to 22 April (%) Source: EUROCONTROL/STATFOR
Examples easyJet “Volcanic ash caused significant disruption to the operation in Q2 with 7,314 flights cancelled impacting nearly a million passengers and costing an estimated £65 (Eur79) million in lost contribution and additional costs caused by application of EU Regulation 2004/261” Lost Revenues: £68 (Eur83) million British Airways Almost 100% flights cancelled btw 15 (11 a.m.) and 20 April “lost passenger and freight revenue together with the costs incurred on supporting passengers approximately £15-20 million (Eur 18-24 million) a day” Lost Revenues: £106 (Eur130) million Air France-KLM 10000 flights cancelled 1 million PAX stranded Lost Revenues: €158 million Ryanair
Worldwide $1.8 billion in lost revenue (IATA) Positive Side - Reduced Fuel Costs $110 million per day European Airlines - AEA Eur 1.2 billion in lost revenue, passenger rights and stranded crew and aircraft Regional Airlines (ERAA) Eur 250 million Charter Airlines (IACA) Eur 310 million Impact on 2010 Profit European airlines forecast to lose $2.8 billion vs. Worldwide Profit of $2.5 billion (IATA, June) Air Traffic Control losing Eur 25 million per day (CANSO, April) 313 Airports – 75% European Network affected Loss of revenue Eur 250 million (15 to 21 April) (ACI) Financial direct loss > Eur 200 million (IAHA)
Kenya’s Fresh Produce Exporters Association Daily Nation loss US$3 million a day for local producers of flowers, fruit and vegetables, thousands of workers temporarily laid off Green beans: losses for African and Kenyan exporters of US$3.9 m and US$2.3 m respectively Flowers: Lost sales may cost Kenya US$7 million over 1 week Lost sales to African countries may total US$65 million (World Bank President) Network Impacts Net loss global GDP from stranded workers in range US$280-$700 million Temporary suspensions in production at BMW and Nissan in Germany, USA and Japan due to shortages of air-freighted components Korea Int.Trade Assoc. losses for domestic industries btw April 16 - 19 estimated US$112 million. Suppliers of mobile phones and semi-conductors hardest hit Source: Oxford Economics
Total Impact Europe: $2.6 bn World: $4.7 bn Aviation Net Loss Europe - $1.4 bn World - $2.2 bn Tourism Net Loss Europe - $0.9 bn World - $1.6 bn Induced impact from less output and spending Induced Impact Europe - $0.1 bn World - $0.2 bn Lost Output from stranded Passengers Productivity Net Loss Europe - $0.2 bn World - $0.5 bn Measures taken to cover for stranded passengers Source: Oxford Economics, The Economic Impacts of Air Travel Restrictions Due to Volcanic Ash, Prepared for Airbus
Events - Examples Fire Extreme object collision (aircraft, meteorite), Extreme weather conditions (flooding, tornado, lightning), Earthquakes Pollution (chemical or else) Pandemics Major software bugs Hostile attacks (terrorism) Volcano Ash ... Strategies - Examples Closure of airspace and re-routing Simplified route structure ATS delegation Development of “fallback” systems Moving personnel to another location co-located or close to failing unit ATM Contingencies Source: EUROCONTROL Guidelines for Contingency Planning of Air Navigation Services (including Service Continuity) Edition 2.0
1. Hazard assessment 2. Develop candidate mitigating strategies 3. Economic analysis of each mitigating strategy 4. Propose informed local policy of Service Continuity • List and describe the outages • Determine the probability of occurrence of -clusters of- outages • Perform an economic assessment of the “Wait and see” scenario • Describe the operating concept of the strategy • Describe how it matches the outages • Dialogue with the stakeholders • Perform analysis for each category of stakeholders • Finalise the economic analysis: Dropping the least cost-effective mitigating strategies and rank the remainder by merits
Economic analysis of each mitigating Strategy Costs of wait-and-see scenario Delays, Re-routings, Flight Cancellations, Diversion to other airports to Airspace Users Loss of revenues to ANSP Loss of revenues to Airports Costs to passengers Losses to the Country/Regional economy Costs of Mitigating Strategies Investment and Running Cost Example: Building and maintaining a fall-back Air Traffic Control Centre Trade-off between the costs of the ‘wait-and-see scenario’to each main stakeholder and the costs of the mitigating strategies
The probability of occurrence and to a lesser extent the discount rate has decisiveinfluence on economic value Percent of benefit value if received now The costs of wait-and-see Probability of an outage Total number of days of disruptions Investment in mitigating strategy and the cost of maintenance of such investment.
Conclusions • More than 100 000 flights cancelled <> 10 million pax journeys • All segments affected but especially the low-cost segment (61% flights bte 15 and 21 April) • Airlines lost $1.8 billion in revenues worlwide and European airlines Eur1.2 billion • European airlines to lose $2.8 billion in 2010 vs. Worldwide Profit of $2.5 billion • Economic impact beyond aviation including producers of fresh goods, just-in-time supply chains... • Total economic impact : Europe: $2.6 bn, World: $4.7 bn • Need to be prepared: trade-off between the costs of ‘wait-and-see’ and the investment and running costs of being prepared taking account of probabilities of outages