Download
1 / 39
410 likes | 552 Views
Steve Heminger Executive Director, MTC AMPO Annual Conference Oct. 2 - 5, 2007. Commissioners. Mary Peters Secretary of Transportation — Chairperson Jack Schenendorf Of Counsel, Covington & Burling — Vice Chair Frank Busalacchi Wisconsin Secretary of Transportation

E N D
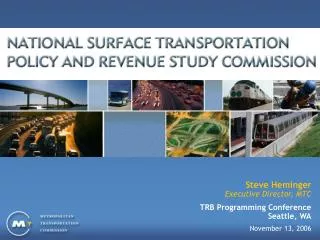
Steve HemingerExecutive Director, MTC AMPO Annual Conference Oct. 2 - 5, 2007
Commissioners Mary Peters Secretary of Transportation — Chairperson Jack Schenendorf Of Counsel, Covington & Burling —Vice Chair Frank Busalacchi Wisconsin Secretary of Transportation Maria Cino Deputy Secretary of Transportation Rick Geddes Director of Undergraduate Studies, Cornell University Steve Heminger Executive Director, Metropolitan Transportation Commission Frank McArdle General Contractors Association of New York Steve Odland Chairman and CEO, Office Depot Patrick Quinn Chairman, American Trucking Association Matt Rose CEO, Burlington Northern Santa Fe Railroad Tom Skancke CEO, The Skancke Company Paul Weyrich Chairman and CEO, Free Congress Foundation
Statutory Mandate • Study current condition and future needs of surface transportation system • Evaluate short-tem sources for Highway Trust Fund revenues and long-term alternatives to replace or supplement fuel tax • Frame policy and funding recommendations for 15-, 30-, and 50-year time horizons • Report to Congress by January 1,2008
Field Hearings • September 20-21, 2006Dallas, TX • November 15–16, 2006New York, NY Memphis, TN • February 21–22, 2007 Los Angeles, CA Atlanta, GA • March 19, 2007Washington, DC • April 18–19, 2007 Chicago, IL Minneapolis, MN
Dramatic Increase in U.S. Maritime Trade 15,835 59,420 2,557 1,776 4,478 Seattle NY/NJ 4,396 1,798 5,566 1,809 Tacoma Virginia 3,382 2,043 6,639 1,860 Oakland Charleston 13,101 9,420 1,662 6,165 LA/LB 1,437 Savannah 2,152 1,010 Houston (TEUs in thousands) Miami 2004 Forecast figures based on 10-year linear regression 2020 Volume of trade: 2004 and 2020 Source: U.S. DOTv
Central region +71% Northeast region +58% West region +65% South region +71% More trade means more domesticfreight movements… U.S. domestic freight tonnage growth forecast, 2000-2020 U.S. domestic freight tonnage forecasts by mode, 2000-2020 (tons in millions) 2020 2000 21,682 17,296 13,772 10,700 2,891 1,470 25 2,009 1,054 9 62% 44% 39% 181% 57% % change 2000-2020 Source: U.S. DOT
Freight Tons, Value, and Ton-Miles, 2002 Trucking dominates domestic freight movement; rail is critical to the movement of bulky, lower-value commodities and for heavy shipments moving long distances 80 s Truck 74% Rail 67% 70 Water Air 60 Pipeline Multiple Modes Other/Unknown Modes 50 40% 40% Percent 40 30 20 16% 13% 9% 10 7% 6% 6% 4% 3% 3% 3% 2% 2% 1% <1% 1% <1% 0% 0 Tons Value Ton-Miles Source: Bureau of Transportation Statistics and U.S. Census Bureau, “2002 Economic Census, Transportation, 2002 Commodity Flow Survey,” Table 1b.
Rail Network Today Class I Railroads Track-Miles Owned 400,000 350,000 300,000 250,000 200,000 150,000 100,000 50,000 0 1830 1850 1870 1890 1910 1930 1950 1970 1990 2010 Sources: L. Thompson/World Bank and American Association of Railroads Today’s rail network has been rationalized and downsized to a core network that is descended directly from the 19th Century design
In Congestion for At Least 40 Hours Annually Source: Texas Transportation Institute
Top Dozen Metro Areas Source: U.S. Census
Metros Are Engines of Economic Growth • Combined GDP of top dozen metro areas exceeds combined economic output of 35 states • New York metro area ranks 10th in the world, with a larger economy than India, South Korea or Mexico • Los Angeles and Chicago metro areas rank 18th and 19th — each larger than Belgium, Sweden or Taiwan Source: U.S. Conference of Mayors
Metros Capture Huge Market Share Sources: U.S. Census, Texas Transportation Institute, U.S. Conference of Mayors, EPA
U.S. Population Change, 2000–2050 Source: Woods & Poole 2002; University of Pennsylvania School of Design
230 59 percent more energy performance 2004 210 2003 2002 190 2001 2000 1999 1998 170 1997 1996 52 percentmore output Horsepower 1995 1994 150 1993 1977 1992 1975 1991 1978 1990 1989 130 1976 1988 1979 1985 1987 1984 1980 110 1986 1983 1982 1981 0 0 12 14 16 18 20 22 24 Miles per Gallon Sources: Environmental Protection Agency; Energy Information Administration U.S. Fuel Economy for New Light-Duty Vehicles 1975–2004 Model Years Sales-Weighted Horsepower and MPG
Source: UC Berkeley International Fuel Economy Comparison Comparison of fleet average fuel economy and GHG emission standards for new-sale light-duty vehicles
World and U.S. Greenhouse Gas Emissions Compared Source: U.S DOE 1 Sources: US DOE and EPA
Is the Public Ready for Change? Source: The New York Times / CBS News Poll, April 2007
U.S. and G.B. Traffic Fatalities Per 100 Million VMT Source: Leonard Evans, Traffic Safety, 2004
U.S. Traffic Deaths Far Exceed Casualties of War Source: Leonard Evans, Traffic Safety, 2004
Environmental Impact Statement Processing Time (FY 1998–2006) Source: FHWA
Length of Time to Complete the New Starts Process Source: Holland & Knight
Street and Highway Construction Costs Have Increased Dramatically Over the Past Few Years Source: AGC
Highway Account Cash Balance Source: FY 2008 President’s Mid-session Projections
Mass Transit Account Cash Balance Source: FY 2008 President’s Mid-session Projections
National Funding Gap 600 Cost toImprove 500 Cost toMaintain Revenue 400 Gap to Improve = $107 Billion per year(through 2015) Year-of-Expenditure Dollars (in Billions) Gap to Maintain = $50 Billion per year(through 2015) 300 200 100 2006 2009 2012 2015 2018 2021 2024 2027 2030 Year Source: U.S. Chamber of Commerce
Excise MFT Additional MFT State Gasoline Tax Rates including Sales and Petroleum Taxes Plus Local Option Gas Tax As of April 2006 Cents per Gallon 50 45 40 35 30 25 20 15 10 5 0 NY CT MI NV FL RI IN OH ME WV ID OR SD MD ND MN IA NH DC TX VI MS NM OK NJ AK CA IL WI PA HI WA NC MT NE GA KS UT MA DE CO AR TN AL LA VT AZ KY MO SC WY State Source: American Petroleum Institute
Recent Public Private Partnerships Hiawatha Light Rail Line Northwest Parkway Tacoma Narrows Bridge Denver E-470 Chicago Skyway Asset Sale CREATE I-15 Reconstruction Indiana Toll Road Asset Sale Jamaica JFK Airtrain Reno Rail Corridor Hudson Bergen Light Rail Line - Las Vegas Monorail Camden Trenton Light Rail Line Alameda Corridor Dulles Greenway Foothill Eastern Toll Road Pocahontas Parkway SR 125 Toll Road San Joaquin Hills Toll Road Southern Connector AZ-17 NM 44 (US 550) Central Texas Turnpike Osceola Parkway Project Location Trans Texas Corridor - Intermodal Projects in Green Miami Intermodal Center Highway Projects in Blue Transit Projects in Yellow Source: Public Works Financing
“Our unity as a nation is sustained by free communication of thought and by easy transportation of people and goods... Together the unifying forces of our communication and transportation systems are dynamic elements in the very name we bear — United States. Without them, we would be a mere alliance of many separate parts.” — Dwight D. Eisenhower, 1955