Download
1 / 25
250 likes | 425 Views
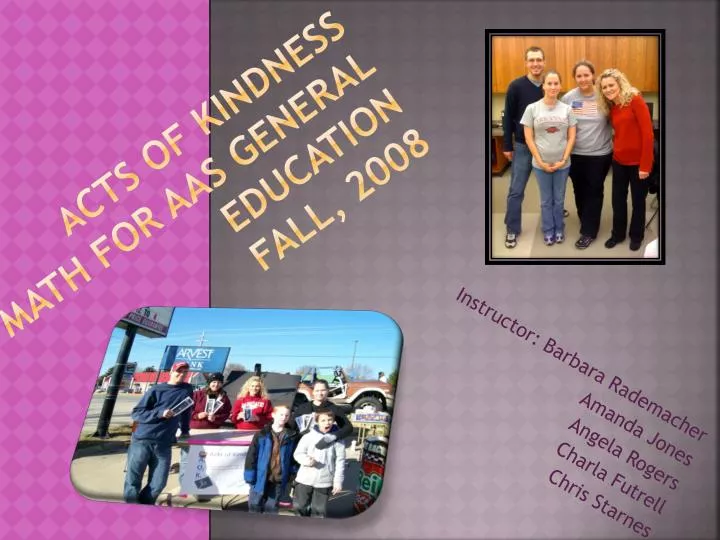
A CTS OF KINDNESS Math for AAS General Education Fall, 2008. Instructor: Barbara Rademacher Amanda Jones Angela Rogers Charla Futrell Chris Starnes. HISTORY. The less fortunate will always be with us, but we believe it is our job to help take care of them.

E N D
ACTS OF KINDNESSMath for AAS General EducationFall, 2008 Instructor: Barbara Rademacher Amanda Jones Angela Rogers Charla Futrell Chris Starnes
HISTORY • The less fortunate will always be with us, but we believe it is our job to help take care of them. • The Samaritan Center stood out as a great place to focus our attentions. • We formed other areas of service as well. • Our group is aware of another project prior to ours that focused on community service.
PROJECT GOALS • IMPROVE THE LIVES OF THE LESS FORTUNATE • MOTIVATE OTHERS TO CATCH THE VISION OF VOLUNTEERING • INCREASE OUR INTERPERSONAL SKILLS • USE MATH SKILLS LEARNED IN MS. RADEMACHER’S CLASS • INCREASE OUR WORKING KNOWLEDGE OF THE COMPUTER
Community Benefits • Our “Community” is defined as the people of Benton County. We share a common culture with other Arkansans. • We volunteered throughout the semester. • Served Sunday Breakfasts • Put together SNACK PACKS for Schools • Enlisted Volunteers at a Car Show • Made Flyers to Distribute at Car Show • Made Poster for Advertising our Organization • Cleaned neighborhood streets
COURSE CONTENT • Data used: • We used Statistics from The Samaritan Center, a Sampling of Friends and Family, Car Enthusiasts, and from marching in the Rogers Christmas Parade. • We used a pie chart, a line chart, and a pictograph which you will see shortly. • How did you organize data and draw conclusions. • We used data that we gathered from serving at the soup kitchen and serving on Sunday mornings to help us . • How did you use standard deviation of a data set? • We found the mean (average), median and mode • Then we calculated the standard deviation. • Information was gathered from the Samaritan Center.
Technology • Computers • Microsoft Publisher • Microsoft Excel • Microsoft Word • Microsoft Power Point (AMANDA LOVES) • Internet • Wikis • Graphing Calculators • Cell Phones • Digital Cameras • Poster Machine
TIME LINE • Wednesday Sept. 17, 08 met with Samaritan Center (Jane Rolland) • Sunday 21, 08 Serving breakfast @ Samaritan Center • Thursday for next 3 weeks serving Lunch • Monday Sept. 22nd putting together snack packs going forward • Monday Sept. 22nd Initial Proposal due • Wed. Sept. 24th Put together snack packs for schools • Thurs. Oct. 9th Put together snack packs for schools • October 15th started walking neighborhoods picking up trash • October 31st Walked neighborhood picking up trash • October 24th finished brochures and printed off
TIME LINE CONT. • November 11th started making research questions on community • November 12th did survey on Community Service • November 21st worked on PowerPoint • November 22nd Pass out brochures at Car Show • Group members serving at Samaritan Center throughout semester on Wednesday & Thursday • November 30th Springdale Samaritan Center Served Thanks giving meal. • December 1st march in parade pass out A.O.K brochures, worked on final Presentation • December 5rd Final Presentation due
Benton CountyDHS Programs for the less fortunate SNAP: 4629 cases B.C. / 160480 in Arkansas ArKids First: 5000 cases in B.C. / 125000 in Arkansas Medicaid: 26470 cases in B.C. /610412 in Arkansas *Benton County has the Second Highest number enrolled in ARKids First in State Information by: Preston Haley, Division of County Operations at the Department of Human Services
Survey/research Questions Have you ever volunteered for a local organization before? • What organization have you volunteered? • What other ways have you served your community? • For what reasons did you serve your community? ( Work, School, College)
Results to survey question #1 45 out of 60 people Volunteered for an organization 15 out of 60 people have never volunteered
Results to survey questions A, B • Helping Hands • Boy Scouts • Boys & Girls Club • Samaritan Center • Child of Angels Fellowship • Red Cross • Restoration Village • Habitat for Humanity • Battered Women’s Shelter • Salvation Army • Angel Food Ministries • Richardson Center • Seven hills • City of Bentonville/Rogers • Volunteer CNA • Volunteer Firefighter • Bentonville/Rogers Public Schools • Mission Trips • Public servant in Politics • Community Walk-a-bout • Rogers Youth Center What organizations have you volunteered at Other ways people have served the community
Reasons for Volunteering “ I have dealt with abuse in my family for along time so it is my personal decision to give my time to the battered women's shelter who has brought our family security in the worse of times” ( Anonymous) “ Working in Construction we work with a lot of families who are in need and don’t have the financial stability to have a livable home and through our company we were able to give deserving families homes that they need” ( Anonymous) “ I have not gotten the chance to actually volunteer at a organization but in the mean while I am working as a volunteer at my church as a preschool teacher and love working with children” (Anonymous)
Sunday Mornings at the Samaritan House • Mean: 93.1people • Median: 93.5 people • Mode: No similarities • Range: 50 people • Midrange: 84.5 people • Standard Deviation: 22.52
Soup Kitchen at the Samaritan House • Mean: 41.6 • Median: 56.5 • Mode: no similarities • Range: 35 • Midrange: 42.5 • Standard Deviation: 8.22
Skills Developed Developed People Skills Working with Fellow Students Within Our Group Cooperation Responsibility Time Management Networking Within the NWACC Community Developed Relationships With Samaritan Center Employees Met and Mingled with O’Reilly’s Staff Communicated with EAST Lab director Learned from Our Math for AAS Teacher Overall Professional Enrichment Academically Technology Service to the Community
COMMUNITY CONTACTS Debbie Rambo- Director of Samaritan Center Jane Rowland- Care advocate Megan Needham- Care advocate Brandy Knight- Snack Packs Program Coordinator Gary Evans- Dental Clinic Charlene Phillips- General Manager for O’Reilly’s in Rogers
Community Service Never Goes Out of Style • People can continue our work in many ways: • Educating Others about the Needs of Community Organizations • Going forward with the Work of AOK at The Samaritan Center • Meeting the Physical Needs of People in Their Circle of Influence • East/Empacts future students can get a “Vision to Volunteer” in his/her own time