LDEQ
LDEQ. RECAP. RECAP. Identification of the Area of Investigation AOI . RECAP.

LDEQ
E N D
Presentation Transcript
LDEQ RECAP
RECAP Identification of the Area of Investigation AOI
RECAP The AOI is the zone contiguous to, and including, impacted media defined vertically and horizontally by the presence of one or more constituents in concentrations that exceed the limiting standard applicable for the option being implemented.
Identification of the AOI • Identify limiting standard for option • Compare limiting standard to concentration detected at each sampling location • Identify each location where the concentration > limiting standard • Define the horizontal and vertical boundaries of AOI
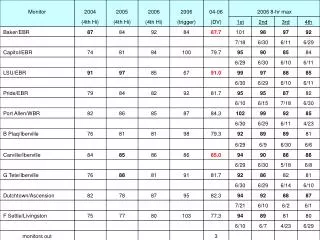
Identification of the AOILRS = 10 ppm B15 15 ppm B14 18 ppm B4 < 0.005 AOI B5 12 ppm B2 16 ppm B16 6 ppm B1 55 ppm B12 <0.005 B13 29 ppm B6 17 ppm B7 <0.01 B3 32 ppm B11 18 ppm B8 <0.005 B18 9 ppm B9 22 ppm B10 4 ppm B17 <0.005
Identification of the AOILRS = 10 ppm B4 <0.01 AOI SS B2 14 ppm B14 6 ppm B1 33 ppm B5 <0.01 3’ bgs AOI PSS B16 4 ppm B13 13 ppm B7 <0.01 B3 12 ppm B11 11 ppm B8 2ppm 15’ bgs B18 <0.01
Identification of the AOI • Illustrate all sampling locations and AOI • Summarize AOI data set • All impacted media
Identification of the AOITiered Approach SO: Identify all sampling locations > SS Area > SS AOI for MO-1 If all locations < SS NFA
Identification of the AOITiered Approach MO-1: 1) AOI defined by locations > SS 2) Determine E/SC for AOI 3) Compare to MO-1 LRS, if < LRS NFA 4) If E/SC > LRS Id AOI for MO-2 MO-1 AOI (Area > SS) MO-2 AOI (Area > MO-1 RS)
Identification of the AOITiered Approach MO-2: 1) AOI defined by locations > MO-1 LRS 2) Determine E/SC for AOI 3) Compare to MO-2 LRS; if < LRS NFA 4) If E/SC > LRS Id AOI for MO-3 MO-2 AOI (Area > MO-1 RS) MO-3 AOI (Area > MO-2 RS)
Identification of the AOITiered Approach MO-3: 1) AOI defined by locations > MO-2 LRS 2) Determine E/SC for AOI 3) Compare to MO-3 LRS, if < LRS NFA 4) If E/SC > LRS Id area to be remediated MO-3 AOI (Area > MO-2 RS) Remediate Area > MO-3 RS
Identification of the AOISite-specific SoilSSi/ni • If AOC does not qualify for SO: • Area of impacted soil > 0.5 acre • all other criteria for SO are met • Develop site-specific SoilSSi or SoilSSni • site-specific area of impacted soil • Appendix H
Identification of the AOI Site-specific SoilSSi/ni • Identify limiting SS • site-specific SoilSSi or SoilSSni • Table 1 SoilSSGW • Identify AOI using limiting soil SS • May be re-iterative process
Identification of the AOI • If multiple chemicals present: • Identify one AOI that includes all chemicals • Identify an AOI for each chemical
Identification of the AOI • One AOI that includes all COCs: • Ex) BTEX B T, X AOI E
Identification of the AOI • Identification of an AOI for each COC: • Ex) BTEX AOI for B AOI for T, X AOI for E
Identification of the AOI • If only 1 or 2 sampling locations > SS or LRS: • Identification of an AOI is not possible • Options: • Evaluate under higher tier • If appropriate, re-sample area • Remediate impacted area(s)
Identification of the AOISingle vs Multiple AOI AOI • Considerations: • Distance • Receptor activity patterns • COC AOI AOI
Identification of the AOIMultiple AOI and Additivity AOI AOI • Considerations: • Distance • Receptor activity patterns • COC AOI AOI
Identification of the AOIBased on Pathways Enclosed Structure Soil AOI • Soili or Soilni • Soilgw • Soilsat Soil to ES AOI • Soiles
Identification of the AOIBased on Pathways Soil AOI • Soili or Soilni • Soilgw • Soilsat • Soiles Enclosed Structure
Identification of the AOIBased on Pathways Enclosed Structure Groundwater AOI • GW1, 2, or 3 • Watersol GW to ES AOI • GWes
Identification of the AOIBased on Pathways Groundwater AOI • GW1, 2, or 3 • Watersol • GWes Enclosed Structure
Identification of the AOIBased on Pathways Soil-PEF AOI Soil AOI • Soili or Soilni • Soilgw • Soilsat Unpaved Road
Identification of the AOIBased on Pathways Soil-PEF AOI • Soili-PEF or Soilni- PEF • Soilgw • Soilsat
Identification of the AOIBased on Land Use Residential AOI • Soilni • (Soilgw) • (Soilsat) Industrial Soil AOI • Soili • Soilgw • Soilsat Industrial property boundary
Identification of the AOIBased on COC AOI for COC #1 AOI for COC #2
Identification of the AOIRemediation Verification Post-Remediation AOI Area Identified for Remediation (Area > LRS)
Exposure/Source Concentration95% UCL-AM • 95% UCL-AM concentration • All data points on or within the AOI
Identification of the AOILRS = 10 ppm B15 15 ppm B14 18 ppm B4 < 0.005 AOI B5 12 ppm B2 16 ppm B16 6 ppm B1 55 ppm B12 <0.005 B13 29 ppm B6 17 ppm B7 <0.01 B3 32 ppm B11 18 ppm B8 <0.005 B18 9 ppm B9 22 ppm B10 4 ppm B17 <0.005
Exposure/Source Concentration 95% UCL-AM Dataset for the 95%UCL-AM: B1 55 ppm B7 0.01 ppm B2 16 ppm B9 22 ppm B3 32 ppm B11 18 ppm B4 0.005 ppm B13 29 ppm B5 12 ppm B14 18 ppm B6 17 ppm B15 15 ppm
Exposure/Source Concentration95% UCL-AM • Determine constituent distribution • LogNormal* • Normal • Non-Normal
Exposure/Source Concentration 95% UCL-AM • Use methods consistent with RECAP • Supplemental Guidance to RAGS: Calculating the Concentration Term (EPA 1992) • Statistical Methods for Environmental Pollution Monitoring (Gilbert 1987) • LogNormal distribution: H-Statistic • Normal distribution: Student-t Statistic
Exposure/Source Concentration 95% UCL-AM • Identify data points used to calculate 95%UCL-AM • Present statistical calculations/spreadsheets • Limited data set or high variability • Maximum detected value