Download
1 / 38
380 likes | 528 Views
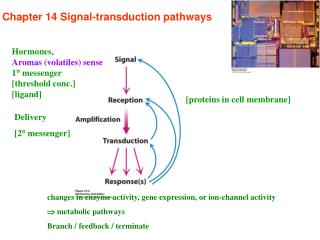
Student Success: Pathways Grades 7 - 12 Initiative. 1. Historical Context 2. TDSB Context (Schools & Students) 4. Impact of Secondary School Policy on Student Success 5. What are we doing to improve Student Success in TDSB?. HISTORICAL CONTEXT. 1870

E N D
Student Success: PathwaysGrades 7 - 12 Initiative 1. Historical Context 2. TDSB Context (Schools & Students) 4. Impact of Secondary School Policy on Student Success 5. What are we doing to improve Student Success in TDSB? E03(Pathways/CERGStudSuccessPwrpt)rb.3371
HISTORICAL CONTEXT E03(Pathways/CERGStudSuccessPwrpt)rb.3371
1870 • 5-6% of students entered high school (commercial, academic) • 25% entered university 1960 - 5 year / 4 year programs - streaming - students “locked” into streams - Students passed/failed (full year) 1972 - Credit system - students passed/failed courses (streamed by ability) - 2/3 students in general level dropped out - job opportunities for students graduating in general level - poor (OSSTF research) - Wells “Before the end of the 70s, grade 13 will be a thing of the past” E03(Pathways/CERGStudSuccessPwrpt)rb.3371
1984 - Ontario Schools: Intermediate/Senior (OS:IS), Grades 9-OAC - streamed by level of difficulty (Basic/General/Advanced) - 30 credits (110 hours each) required to graduate (16 compulsory credits) 1993 -”The Common Curriculum, Grades 1-9” - no discrete subjects eg. 4 Program areas - Credits and streaming eliminated in Grade 9 - Students either achieve all subjects and move on to Grade 10 or repeat Grade 9 R. Stamp: Schools of Ontario 1876-1976 Gidney (1999) From Hope to Harris E03(Pathways/CERGStudSuccessPwrpt)rb.3371
TDSB CONTEXT - Schools • Variety • TDSB is a Composite system vs. system of composite schools • Organization • 88 secondary schools • 8 junior high schools • 17 alternative schools • Inequitable distribution of programs/specialized schools E03(Pathways/CERGStudSuccessPwrpt)rb.3371
COUNTRY OF BIRTH • 56.4% (47,800) of secondary students were born in Canada • 43.6% (36,976) of secondary students were born outside of Canada in more than 150 different countries • Of those secondary students born outside Canada, the greatest numbers were born to China (4,517 or 5.3%) and Sri Lanka (Ceylon) (2,924 or 3.4%) E03(Pathways/CERGStudSuccessPwrpt)rb.3371
LANGUAGE • English is the mother tongue or primary home language of 55.0% (46,624) of secondary students • 45.0% (38,157) of secondary students have a language other than English as their mother tongues or as the primary language spoken in the home • Over 70 languages are reflected in the language background of secondary students • Chinese and Tamil are the most common languages other than English of secondary students - 11:2% (9,519) of students have Chinese in their language background and 4.0% (3,378) have Tamil E03(Pathways/CERGStudSuccessPwrpt)rb.3371
RECENT ARRIVALS • 13.0% (11,003) of secondary students have arrived in Canada in the last three years • An additional 7.3% (6,196) have arrived in the last 4-5 years E03(Pathways/CERGStudSuccessPwrpt)rb.3371
Percent of children in poverty in GTA 40% 35% 30% 25% % of children (0-12) under LICO 20% 15% 10% 5% 0% Halton York Toronto Durham Peel Region/Municipality E03(Pathways/CERGStudSuccessPwrpt)rb.3371
IMPACT OF ONTARIO SECONDARY SCHOOL POLICY ONSTUDENT SUCCESS E03(Pathways/CERGStudSuccessPwrpt)rb.3371
International Assessment • Only two countries - Finland and Hong Kong (China) - topped Canada’s performance in math, which was the main focus of the 2003 study conducted for the Organization for Economic Co-operation and Development (OECD). • Ontario ranks among the top provincial performers compared to the Canadian average, second to Alberta. • In reading, Canada was second only to Finland. • The report also praised Canada for cultivating high scores from students across various socio-economic backgrounds (narrowing the achievement gap). • In Canada and especially Ontario, not only are high average standards maintained, but differences in the extent to which students reach these standards are determined relatively little by their home background. E03(Pathways/CERGStudSuccessPwrpt)rb.3371
Year 2000 Ontario Student Flow from Grade 9 to Post Secondary Destinations “Projections” 24% OSSD to work 25% Leave Before OSSD 23% to College 28% to University Grade 9 Enrollment = 100% Double Cohort Study 2002 Ontario Ministry of Education E03(Pathways/CERGStudSuccessPwrpt)rb.3371
Students in the Grade 9 Cohort of Fall 2003 • 17% of Grade 9 students completed fewer than 7 credits by end of 2003-4. • Proportion completing fewer than 7 credits has declined slightly over past four years. E03(Pathways/CERGStudSuccessPwrpt)rb.3371
While 26% of Grade 9 students in the lowest income grouping had achieved less than 7 credits by the end of Grade 9, only 7% of students in the highest income grouping had failed to acquire 7 or more credits. This pattern is very similar to that of previous years. E03(Pathways/CERGStudSuccessPwrpt)rb.3371
Grade 10 Students as of Fall 2003 • 25% of Grade 10 students completed 14 or fewer credits by end of 2003-4. E03(Pathways/CERGStudSuccessPwrpt)rb.3371
As absenteeism increases, students are more likely to be behind in their credit accumulation by the end of Grade 10, putting them more at-risk of dropping out. E03(Pathways/CERGStudSuccessPwrpt)rb.3371
Literacy Requirements (OSSLT/OLC) • 82% of student had completed their literacy requirement by end of Year 4 (Grade 12). E03(Pathways/CERGStudSuccessPwrpt)rb.3371
Dropout rate of Grade 10's based on credit accumulation 60% 40% 32% 40% Dropout rate 21% 14% 20% 5% 0% 12 13 14 15 16 Number of Credits Earned by 16 years of age E03(Pathways/CERGStudSuccessPwrpt)rb.3371
The proportion of 17 year old (Grade 12) students graduating has increased over time. • The proportion of 17 year old graduates returning for Year 5 is less than a third of what it was under OS:IS. • The trend is that students who are now returning for a fifth year tend to have lower credit accumulation. E03(Pathways/CERGStudSuccessPwrpt)rb.3371
39% of 17 year old students applied to Ontario universities (including 6% who also applied to community colleges), and 26% actually registered. • 12% of 17-21 year olds applied to Ontario community colleges (include 6 % who also applied to universities), and 5% actually registered. E03(Pathways/CERGStudSuccessPwrpt)rb.3371
Average Age at which Students Decide to Attend University Source: Acumen Research’s 2001 University Applicant Survey E03(Pathways/CERGStudSuccessPwrpt)rb.3371
Barriers to Post-Secondary Education Q: What was the Most Important Reasons for Not Pursuing Post-Secondary Education? (High-School Graduates who did not go on to PSE) Source: Statistics Canada’s School Leavers Survey (1991 and 1995) E03(Pathways/CERGStudSuccessPwrpt)rb.3371
Parental Aspirations (% of children whose parents say they:) E03(Pathways/CERGStudSuccessPwrpt)rb.3371
What are we doing to improveStudent Success? E03(Pathways/CERGStudSuccessPwrpt)rb.3371
Goals of the TDSB Student Success initiative are: • to increase Equity of access and outcomes for all students • to increase Program choices • to engage and re-engage students who are at risk of dropping out of school • to increase the number of students who achieve “16 credits by age 16” • to increase the number of students who graduate with an Ontario Secondary School Diploma (OSSD) E03(Pathways/CERGStudSuccessPwrpt)rb.3371
March 2001Toronto District School Board Approved: VISION FOR CHANGE DIRECTIONAL STATEMENTS SYSTEM INITIATIVE LAUNCHED E03(Pathways/CERGStudSuccessPwrpt)rb.3371
In March, 2001, the following directional statements were approved by the Board: • Parents, students and community members are integral to the success of the TDSB vision and they will be involved throughout the process of planning for secondary school programs • All destination pathways (university, college and workplace) will be equally valued and equitably supported in planning, communicating, resourcing and acting • System leaders will take responsibility for educating students, parents, staff and community members about the full potential of each destination pathway E03(Pathways/CERGStudSuccessPwrpt)rb.3371
Schools will share responsibility for students in school to school transitions using shared information systems and assuring that resource allocation and intervention strategies are implemented for those at risk • All system leaders will share responsibility for continuous improvement in student achievement and for identifying and addressing gaps in our service model • The system will assure that students have access to a range of appropriate programs that meet their varying needs within a reasonable geographical region of their homes E03(Pathways/CERGStudSuccessPwrpt)rb.3371
Each school will assume ownership for the care and support of students within the boundary of that school community and provide direct service or assure connection to service that meets each student’s programming needs E03(Pathways/CERGStudSuccessPwrpt)rb.3371
Research Underway • consultation process with schools, parents, superintendents and system leaders • research provided through literature search and in consultation with OISE/UT • an investigation of TDSB data banks and Ontario reports re: patterns of student success • Student voices (“Imagine Student Success” initiative) - interviews with at-risk students • Research on program effectiveness • Targets: supporting, tracking and monitoring 15% of students who are identified as most “at risk” • Tracking and monitoring student progress • Identifying resources and program needs through SIP E03(Pathways/CERGStudSuccessPwrpt)rb.3371
Coordinating Programs to ensure equity of access and increase program choices • It is very difficult for any one school to sustain all the pathways that students need • Resources are spread too thinly to support all programs in all schools • Facilities to support program require upgrading/renewal • Access patterns across the City are inequitable • Most vulnerable students are travelling the furthest to receive appropriate programs/services E03(Pathways/CERGStudSuccessPwrpt)rb.3371
Initiatives Include: • Ministry-funded pilots to inform future policy and funding • Building Bridges $2.4M • “Learning to 18” (in final approval stage) • Others include: • Middle Years Literacy • Summer School/Camps • Tutoring - Grades 7-12 • Homework Clubs • Expansion of Placement Centres • Partnerships • Colleges - eg. Seneca • University: Windsor, UofT, York, Ryerson • Sector Councils E03(Pathways/CERGStudSuccessPwrpt)rb.3371
Specific Initiatives • Ministry-funded pilots to inform future policy and funding • Building Bridges 2.4M • Learning to 18 • Students Success • Partnerships - Colleges/Universities/Community groups • Tutoring and Intervention Programs E03(Pathways/CERGStudSuccessPwrpt)rb.3371
To improve equity of Outcomes: • Focus on professional development and appropriate classroom resources in all Program areas (Grades 7-12) in order to: • support teachers in expanding and enhancing teaching methodology • introduce or expand programs that support Student Success • Expand knowledge of career opportunities for students, teachers, and parents including direct experience E03(Pathways/CERGStudSuccessPwrpt)rb.3371
PROCESS • January 2005 - Complete Identifying all existing specialized programs and specialized/alternative schools • Complete Analysis of facilities/enrolment trends in each school • February 2005 Meetings in each region with school staff/superintendents/trustees to suggest additional programs/schools per region/quadrant • March 2005 School principals meet with staff, community to propose sites • May 2005 Recommendations to Board on proposed sites to date for approval • July 2005(on-going) Facility Renewal and program implementation E03(Pathways/CERGStudSuccessPwrpt)rb.3371