Download

1 / 82
900 likes | 1.18k Views
Module 2: Fundamentals of Epidemiology. Observational Studies. Developed through the APTR Initiative to Enhance Prevention and Population

E N D
Module 2:Fundamentals of Epidemiology Observational Studies Developed through the APTR Initiative to Enhance Prevention and Population Health Education in collaboration with the Brody School of Medicine at East Carolina University with funding from the Centers for Disease Control and Prevention
Acknowledgments This education module is made possible through the Centers for Disease Control and Prevention (CDC) and the Association for Prevention Teaching and Research (APTR) Cooperative Agreement, No. 5U50CD300860. The module represents the opinions of the author(s) and does not necessarily represent the views of the Centers for Disease Control and Prevention or the Association for Prevention Teaching and Research. APTR wishes to acknowledge the following individual that developed this module: Jeffrey Bethel, PhD Department of Public Health Brody School of Medicine at East Carolina University
Presentation Objectives • Recognize criteria for initiating various observational studies • Identify design components of various observational studies • Calculate and interpret outcome measures in various observational studies • Recognize advantages and disadvantages to various observational studies
How did we get from here… Images obtained from: http://tobacco.stanford.edu
and here… Images obtained from: http://tobacco.stanford.edu
Analytic Study Designs Experimental studies (experimental) Cohort studies (observational) Case-control studies (observational) Cross-sectional studies (observational)
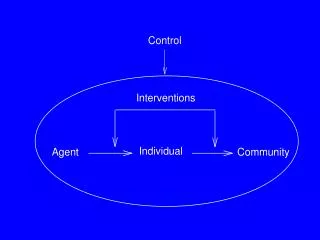
Observational Studies Used to study a wider range of exposures than experimental studies “Natural” experiments Mitigate many issues which are not feasible in experimental studies
Observational Studies • Etiology • What are risk factors for developing disease? • Includes study of behaviors, occupational or environmental factors • Prognosis • What factors predict mortality or disability? • What elements of care predict other health-related outcomes (e.g. quality of life)?
Cohort Studies Cohort derived from Latin cohors = warriors, group of persons proceeding together in time “Exposed” and “unexposed” are selected by the investigators to be followed longitudinally over time to observe difference in the incidence of the outcome Incidence or follow-up studies
Cohort Study Design STUDY POPULATION NON-RANDOM ASSIGNMENT EXPOSED UNEXPOSED Develop Disease Do Not Develop Disease Develop Disease Do Not Develop Disease
Prospective Cohort Study Design STUDY POPULATION Present NON-RANDOM ASSIGNMENT UNEXPOSED EXPOSED Future Do Not Develop Disease Develop Disease Do Not Develop Disease Develop Disease Future
Retrospective Cohort Study Design STUDY POPULATION Past NON-RANDOM ASSIGNMENT UNEXPOSED EXPOSED Past Develop Disease Develop Disease Do Not Develop Disease Do Not Develop Disease Past
Cohort StudiesWhen to Initiate? Due to large sample size, long follow-up time required and usual high cost, cohort studies usually initiated when: • Sufficient evidence obtained from less expensive studies to indicate association of disease with certain exposure(s) • New agent requires monitoring for possible association with several diseases • e.g. Oral Contraceptives or Hormone Replacement Therapy
Cohort Studies Assembling Cohort • Select groups based on exposure status (exposed and unexposed), follow through time and assess outcome • Select defined population (e.g. occupation, geographic area) before exposure, follow through time to separate by exposure status, and assess outcome
Cohort Studies Defined Populations • Framingham • http://www.framinghamheartstudy.org/ • Nurse’s Health Study • http://www.channing.harvard.edu/nhs/ • Women’s Health Initiative • http://www.nhlbi.nih.gov/whi/ • Health Professional’s Follow-up Study • http://www.hsph.harvard.edu/hpfs/
Cohort Studies Inclusion Criteria • Women’s Health Study • ≥ 45 years • No history of coronary heart disease, cerebrovascular disease, cancer, or other major chronic illness • No history of side effects to any of study medications • Were not taking any of following meds more than once per week: aspirin, NSAIDs, supplements of vitamin A, E, or beta-carotene • Were not taking anticoagulants or corticosteroids
Cohort Studies Assembling Cohort • Potential sources • Occupational cohorts: ease of identification and adequate number exposed (e.g. Nurse’s Health Study) • Prepaid health plan members: ease of identification and health records • Schools, military: ease of identification and follow-up
Cohort Studies Determining Exposure Questionnaires Laboratory tests Physical measurements Special procedures Existing records
Cohort Studies Selecting Comparison Group Compare the outcome for the “exposed” group to the outcome in a “substitute” population Substitute population represents the “exposed group without the exposure” Validity of inference depends on finding a valid substitute population
Cohort Studies Internal Comparison Group • From same sample as exposed but do not have exposure • Strengths • Most comparable to exposed group • Weaknesses • May be difficult to identify • Similar population probably has similar exposures
Cohort Studies External Comparison Group • General population, other occupation • Strengths • Accessible, stable data • Weaknesses • Lack of comparability with exposed group • Results may suffer from healthy worker effect • Data on key variables may be missing
Cohort Studies Measuring Disease • Sources of information include: • Death certificates (if fatal) • Hospital records (if hospitalization required) • Disease registries (e.g. cancer, birth defects) • Physicians records • Physical exam (e.g. Framingham) • Laboratory tests (e.g. infectious diseases) • Questionnaires (if physical not required)
Cohort Studies Framingham Study Large prospective cohort study providing longitudinal data on cardiovascular disease Recruits residents of Framingham, Massachusetts in whom potential cardiovascular risk factors were first measured nearly 50 years ago
Cohort Studies Framingham Study Hypotheses • Incidence of coronary heart disease (CHD) increases with age and occurs earlier and more frequently in males • Persons with hypertension develop CHD at a greater rate than those who are normotensive • Elevated blood cholesterol level is associated with an increased risk of CHD • Tobacco smoking and habitual use of alcohol are associated with an increased incidence of CHD
Cohort StudiesAnalytic Approach – Relative Risk Relative Risk = Incidence in Exposed Incidence in Unexposed Measure of association used for deriving a causal inference
Cohort StudiesAnalytic Approach – Relative Risk a a+b c c+d Relative Risk = Incidence in Exposed = a/a+b Incidence in Unexposed c/c+d
Cohort StudiesAnalytic Approach – Relative Risk • If Relative Risk = 1 exposure is NOT associated disease • If Relative Risk > 1 exposure is associated with an increased risk of disease • If Relative Risk < 1 exposure is associated with a decreased risk of disease (i.e. is protective)
Smoking and Coronary Heart Disease 84 _ X 1,000 3,000 87 _ X 1,000 5,000 Relative Risk = Incidence in Exposed = 28.0 Incidence in Unexposed 17.4 = 1.61
Cohort StudiesOther Analytic Approaches Life table Kaplan-Meier plot Incidence proportion Hazard ratio Multiple logistic regression
Calculating Relative Risk A cohort study of smoking and bladder cancer was conducted in a small island population. There were a total of 1,000 people on the island. Four hundred were smokers and 600 were not. Fifty of the smokers developed bladder cancer. Fifteen of the non-smokers developed bladder cancer. Calculate and interpret relative risk (RR)
Smoking and Bladder Cancer Relative Risk Relative Risk = Incidence in Exposed = 0.125 = 5.0 Incidence in Unexposed 0.025 Relative Risk = a/(a+b) = 50/400 = 5.0 c/(c+d) 15/600 Interpretation: Incidence of bladder cancer is 5 times as great in smokers as in non-smokers
Cohort StudiesDisadvantages Inefficient for evaluation of rare diseases If outcome has long latent period, study can take a long time Generally more expensive If retrospective, requires availability of records Validity of results can be seriously affected by losses to follow-up
Cohort StudiesAdvantages • Useful design when exposure is rare • Examine multiple effects of single exposure (multiple outcomes) • If prospective, minimize bias in ascertainment of exposure • Examine temporal relationship between exposure and disease • Allows direct measurement of incidence of disease in exposed and unexposed • Direct calculation of relative risk
Case-Control Study Design NOT EXPOSED EXPOSED EXPOSED NOT EXPOSED DISEASE NO DISEASE CASES CONTROLS
“TROHOC” Studies • Disparaging term given to case-control studies because their logic seemed backwards and they seemed more prone to bias than other designs • Case-control studies are a logical extension of cohort studies and an efficient way to learn about associations
Case-Control Studies When to Initiate? Little is known about the disease Exposure data are difficult or expensive to obtain Rare disease Disease with long induction and latent period Dynamic underlying population
Case-Control StudiesSelection of Cases • Definition of a case • Should lead to accurate classification of diseased and non-diseased individuals • Homogeneous disease entity by strict diagnostic criteria, e.g. distinguishing cancer of the corpus uteri (body of uterus) from cancer of the cervix (neck of uterus) • Applied uniformly
Case-Control Studies Case Definition Black or White women (including Hispanic women self-identifying as Black or White) aged 50–79 years, who were residents in the contiguous nine-county Philadelphia, Pennsylvania, region at the time of diagnosis and newly diagnosed with endometrial cancer between July 1, 1999, and June 30, 2002.
Case-Control Studies Selection of Cases—Sources All cases in a population Representative sample of all cases Disease registries: e.g. cancer, birth defects All hospitals in a community (for diseases requiring hospitalization) Particular hospital or health system Physician records
Case-Control Studies Selection of Controls • Purpose is to provide information on the exposure distribution in the source population • Controls must be identified independently of exposure status • Controls are a sample of the population that gave rise to the cases • Member of control group who gets the disease “would” end up as a case in the study
Case-Control Studies Sources of Controls • General population • Used when cases are identified from well-defined population (e.g. residents of a geographic area) • Sources: RDD, voter reg lists, tax lists, neighborhood • Advantage: generally more representative of non-diseased with respect to exposure • Disadvantage: not as motivated, potentially lower data quality
Case-Control Studies General Population Controls Cases: active surveillance at 61 of 68 hospitals in 9 counties around Philadelphia Controls: RDD controls were selected from the same geographic region as the cases