Download
1 / 17
170 likes | 266 Views
Explore challenges in reconstructing low-frequency variations in sea surface temperature historical data, comparing analysis methods and addressing uncertainties. Findings highlight the impact of bias adjustments and data analysis on accuracy.

E N D
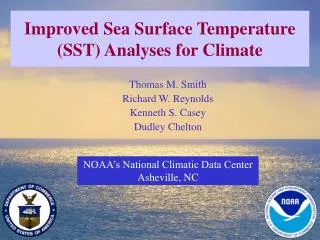
Uncertainties in Low Frequency SST Historical Analyses Thomas M. Smith Richard W. Reynolds NOAA’s National Climatic Data Center
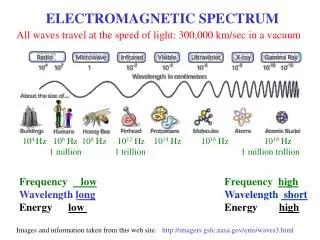
Definitions • Low Frequency (LF)—decadal or longer variations (15-year smoothed). Represents changes in the climate base state. • High Frequency (HF)—everything else, including ENSO and NAO, etc.
The Problem: • How much LF variation can be reconstructed using EOF modes? • HF variations like ENSO are resolved over the recent, well-sampled period. HF modes may be better in historical reconstructions. • LF variations like trends are not stationary and not consistently sampled. It’s not clear how well modes reconstruct historical LF variations. • The problem: without using LF modes more sampling is needed to analyze the LF, and that may give greater uncertainty for the early period.
Global SSTs and NMATs • Global and annual averages • Differences greatest before 1950—data most sparse • Smoothed differences indicate uncertainty in the climate base state From IPCC 2001
Evaluating LF Uncertainties • Data used: ERSST.v2, ICOADS, Kaplan et al., and HadISST SST anomalies through 2004 • Different ways to analyze LF anomalies • ERSST: simple filtering, large scale and 15-years of data • HadISST: leading EOF of filtered data • Kaplan et al: stationary set of modes from a later base period • LF comparisons to show differences • LF of ERSST EOF-mode reconstructions to show possible EOFs damping
ERSST-HadISST Comparisons • Global averages similar and the need for bias adjustments clear • Magnitude of adjustment validated by C. Folland • Adjusted data is sometimes more similar than unadjusted data • HadISST adjustments from a bias model • ERSST adjustments based on analyzed SST-NMAT differences RMS(ERSST-HadISST)
Analyses and Data LF HadISST slightly warmer than ERSST these times: 1915 weaker cools in Pacific 1965 warmer Southern Ocean
LF Zonal Averages • ICOADS much warmer north of 60ºN • few data, Arctic Ocean & N. Atlantic • analyses filter out most of those strong anomalies • ICOADS cooler before 1920 • Tropical W. Pacific, sampling too sparse for analyses
Comparisons: LF of ERSST, ICOADS, & HadISST • Global Averages of LF SSTA for each • LF difference • |ERSST-HadISST| ≤ 0.05ºC • RMSD = 0.02ºC • overall similar climate variation • OS (Kaplan) slightly more damped • ICOADS differences • Cooler early (1901-1930) • Warmer after 1980 • Both analyses may be damping LF anomalies
Summary of ERSST-HadISST LF Comparisons • Global variations similar, both before and after bias adjustments • Differences that occur are due to both bias-adjustment and data-analysis differences • Global ERSST-HadISST LF absolute differences are 0.05ºC or less: • Both resolve LF about equally well • Both are damped compared to ICOADS early in the 20th century
Tests of LF Reconstructions • Different estimates of the ERSST LF are compared: • LF ERSST • LF ERSST reconstructed LF EOFs, based on 1901-2000 • LF ERSST reconstructed LF EOFs, based on 1951-2000 • Both sets of EOFs account for about 90% of the LF variance in their base periods • Test of historical LF variance lost by EOF reconstruction
3 EOF Recon of LF ERSST: Global Averages • EOFs based on full period reconstructs average with little error • If you know it, you can get it back • EOFs based on 2nd half of the period damps variance in the 1st half • Uncertainty as much as 0.08ºC, average 1901-1950 is 0.06ºC
ERSST LF and LF EOF Recons LF EOF Recons impose mean patterns from their base, and are spatially smoother than the analysis. Details of the patterns are not reproduced by the Recons.
Global Averages: RMS Differences • Both ERSST & HadISST LF damped in early 20th century (w.r.t. ICOADS) • Modes only reconstruct the LF variations they span • Damping uncertainty may be unavoidable • Tests & comparison suggest that global LF damping RMSE can be up to about 0.1ºC
Summary of LF EOF Reconstruction • In EOF dependent-period reconstructions: global average close to the base average • In EOF independent-period reconstructions: damping reduces variance • Actual damping in early 19th century may be less than EOF testing suggest: • EOF testing suggest RMSE ≈ 0.09ºC • ERSST decadal RMS error estimate for early 20th century ≈ 0.07ºC (based on sampling of a trend with observed sampling) • Some LF variance may project onto HF modes, reducing errors • LF ERSST-HadISST RMSD = 0.02ºC, max difference ≈ 0.05ºC • Both ERSST & HadISST damped, so their difference does not give the full error
Some Global LF Standard Error Comparisons Standard error estimates of ERSST and comparisons for two periods. ERSST estimates from EOF damping & SR decadal estimates, compared to other estimates. • Boost modern ERSST variance by 1.15: some ERSST damping. • SR ERSST est. from sampling of a trend. • Jones et al. consistent, based on spatial scale estimates. • Folland et al. using large-scale modes. Smaller error estimates may underestimate sampling error.
Conclusions • RMS LF global uncertainties are about 0.07ºC early in the 20th century, when sampling is most sparse • For long (interdecadal) time scales, several different methods give similar uncertainty estimates • Most climate-base changes can be detected through the 20th century • Errors based only on fits to modes can underestimate sampling error • Reconstructing LF without using EOFs may better resolve the large-scale variations, but sampling still a problem • For smaller regions and shorter averaging times, different estimates are less consistent • Some interannual SST episodes may not be analyzed as reliably early in the 20th century