Download
1 / 24
240 likes | 343 Views
Dive into the world of the red shot game through detailed analyzes of factors like shot efficiency and save percentage, determining game outcomes. Explore the significance of offensive and defensive plays, key players' performance, and game strategies. Learn how the distribution of shots influences the game results and why red shots hold vital importance. Gather insights on power play, box play, and shot types crucial for success on the ice.

E N D
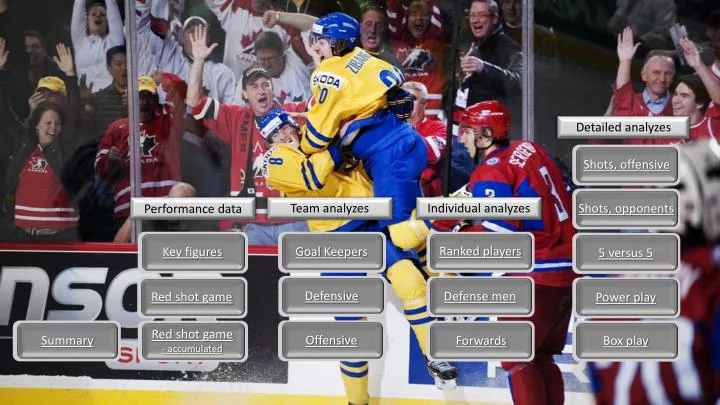
Detailedanalyzes Red shot game - accumulated Rankedplayers Summary Forwards Shots, opponents Shots, offensive Goal Keepers Power play Defensive Offensive Box play 5 versus 5 Red shot game Keyfigures Defense men Team analyzes Individualanalyzes Performance data
Keyfigures • A typical distribution is 72% green shots / 28% red shots • Average shot efficiency for a green shot is 2.6% and 21.6% for a red shot • This corresponds to a save percentage SVS% of 97.4% and 78.4% • A good offense player shoots many red shots • A good defense manprevents red shots from the opponents • A good goalkeeper saves many red shots (and many green shots). Green save percentage varies very little between different goalkeepers • A typical distribution of power play and box play is 60% green shots / 40% red shots Start
Red shot game Conclusion - Comment - What is the red shot game? Legends Redshot Redgoal Start Canadas’sredshots Norway’sredshots
Red shot game – accumulated Conclusion - Comment - What is the red shot game? Legends Redshot Redgoal Start Canadas’sredshots Opponent’sred shots
Red shot game- Since green shots mostly are inefficient, it is worthwhile only looking at the shots with high scoring chance – the redshots • The team that produces most red shots wins the red shot game • The red shot game gives an indication on how successful the offense have been Red shot game Start
Red shot game- Since green shots mostly are inefficient, it is worthwhile only looking at the shots with high scoring chance – the redshots • The team that produces most red shots wins the red shot game • The red shot game gives an indication on how successful the offense have been Red shot game - accumulated Start
Goal keepers- Save percentage, SVS%, green and redshots Typicalaverage save percentage 97.4 % green shots 78.4 % red shots • Averagesave percentage: 97.4 / 78.4 • Roberto Luongo: - / - • Carey Price: - / - • Mike Smith: - / - Conclusion - Comment - Start
Defensive- Shots from the opponents Typicalaverage distribution 72 % green shots 28 % red shots Conclusion - Comment - Start
Offensive- Distribution and shotefficiency Typicalaveragedistribution 72 % green shots 28 % red shots Typicalaverageshotefficiency 2.6 % green shots 21.6 % red shots Conclusion - Comment - Start
Rankedplayers- Best playersaccording to the Performance analyze Start
Defense men- Shot from opponents Typicalaveragedistribution 72 % green shots 28 % red shots Conclusion - Comment - Start
Forwards Distribution, better forwards Distribution, poorer forwards Shotefficiency, better forwards Shotefficiency, poorer forwards Start
Distribution, better forwards Typicalaveragedistribution 72 % green shots 28 % red shots Conclusion - Comment - Forwards Start
Distribution, poorerforwards Typicalaveragedistribution 72 % green shots 28 % red shots Conclusion - Forwards Start
Shotefficiency, betterforwards Typicalaverageshotefficiency 2.6 % green shots 21.6 % red shots Conclusion - Comment - Forwards Start
Shotefficiency, poorer forwards Typicalaverageshotefficiency 2.6 % green shots 21.6 % red shots Conclusion - Comment - Forwards Start
Shots, offensive List of the different shottypes Conclusion - Comment - Start
Shots from the opponents List of the different shottypes Conclusion - Comment - Start
5 verus 5 Typicalaveragedistribution 72 % green shots 28 % red shots Typicalaverageshotefficiency 2.6 % green shots 21.6 % red shots Offensive distribution - % green shots/ - % red shots Offensive shotefficiency- % green shots/ - % red shots Shots from the opponents Defensive distribution- % green shots/ - % red shots Defensive shotefficiency- % green shots/ - % red shots Conclusion - Start
Powerplay Typicalaverage distribution 72 % green shots 28 % red shots Typicalaverageshotefficiency 2.6 % green shots 21.6 % red shots Distribution - % green shots/ - % red shots Shotefficiency- % green shots/ - % red shots Conclusion - Start
Boxplay Typicalaveragedistribution 72 % green shots 28 % red shots Typicalaverageshotefficiency 2.6 % green shots 21.6 % red shots Distribution, opponents - % green shots/ - % red shots Shotefficiency, opponents - % green shots/ - % red shots Conclusion - Start
List ofgreen andred shots • A - green shot (2.6% shot efficiency) • B - short puck contact (15.5% shot efficiency) • C - rebounds (21.2% shot efficiency) • D - deflections (21.2% shot efficiency) • E - screened shots (16.4% shot efficiency) • F - puck transport crossing the central line (27.9% shot efficiency) • G - pass crossing the central line which is followed by a shot (shot 29.3% efficiency) • Averageshotefficiency B-G: 21.6% Shots, offensive Start
List ofgreen andred shots • A - green shot (2.6% shot efficiency) • B - short puck contact (15.5% shot efficiency) • C - rebounds (21.2% shot efficiency) • D - deflections (21.2% shot efficiency) • E - screened shots (16.4% shot efficiency) • F - puck transport crossing the central line (27.9% shot efficiency) • G - pass crossing the central line which is followed by a shot (shot 29.3% efficiency) • Averageshotefficiency B-G: 21.6% Shot, opponents Start