Download

1 / 57
570 likes | 634 Views
UK House Prices, Consumption and GDP in a Global Context. Andrew Farlow University of Oxford Department of Economics, and Oriel College John D Wood & Co., The Cavalry and Guards Club, Piccadilly, London, 20 January 2005 This is based on a paper to be found at:

E N D
UK House Prices, Consumption and GDP in a Global Context Andrew Farlow University of Oxford Department of Economics, and Oriel College John D Wood & Co., The Cavalry and Guards Club, Piccadilly, London, 20 January 2005 This is based on a paper to be found at: http://www.economics.ox.ac.uk/members/andrew.farlow (Syntax slightly improved post-presentation to make the slides more easily readable given the lack of a presenter)
Today’s Presentation: Part Three of Five Parts • Part One: “UK House Prices: A Critical Assessment” • Part Two: “Bubbles and Buyers” • Part Three: “UK House Prices, Consumption and GDP in a Global Context” • Part Four: “Risk Premia and House Prices” • Part Five: “Mortgage Banks and House Prices” • Book: February/March 2006, Publisher: Constable Robinson
UK historically strong housing cycles • Strong housing market cycles, linked to volatile consumption, have been an overriding feature of the UK economy for over three decades. • OECD (2004): 1971-2002, UK the strongest correlation of housing wealth and GDP of any country surveyed. • IMF(2004): The UK (along with Finland, Ireland, and Switzerland) has had one of the most procyclical housing markets in the world.
Something more global this time? • Something extra this time: The “first global house price bubble” (The Economist)? • Small probability large loss events matter. • Even if only a small chance, we should analyze the possibility. • IMF, 2003 World Economic Outlook, 40% of booms followed by busts, and 8% cumulative GDP loss. • State of housing markets, part of a bigger picture of global imbalances?
UK House price falls and GDP falls • No fall in real house prices (blue line) not followed by major fall in UK GDP (gray bands) • Will the pattern repeat? Source: Bank of England Inflation Report, May 2004, p7, Chart 1.10.
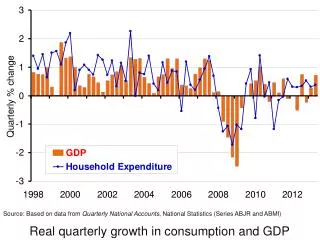
Consumption and House Prices • 1970-mid 1990s, rapid increase in house prices (green line) accompanied by rapid growth of consumption (red line) • Recently, house price inflation has accelerated but the rate of growth of consumption has steadied. Source: Bank of England Inflation Report May 2004, p12, Chart 2.1.
A breakdown? • Misleading causation. • Both driven by income expectations? Not directly observable. • Credit constraints? • A very different central bank response next time?
More evidence: durables and non-durables • Real durable and semi-durables consumption is highly pro-cyclical. • But need to adjust for rapid price falls… Source: Bank of England Quarterly Bulletin, Spring 2004, J Power, Chart 1.
Nominal ratio of durable to non-durable consumption Source: Bank of England Quarterly Bulletin Spring 2004, J Power, Chart 11.
Real house prices and share of durable spending inconsumption • Durables more likely purchased on credit. • Share previously very correlated with house prices. • Correlation has broken down since the late 1990s. Source: Bank of England Inflation Report November 2004
More Evidence • Swings in spending relative to income – in all periods - of homeowners is nearly as great as renters. • But: risk premia and options thinking of owners, etc. Source: BOE Inflation Report May 2004, p12, Chart 2.3, based on the Family Expenditure Survey.
Possibilities • Credit constraints less important? • No upwards revision in expected future earnings and wealth? • This would have driven higher housing demand (and house prices) and higher desired stock of durables. • Flow increase in durables expenditure on the path to new desired stock level.
Awkward Conclusions • If real income expectations are pretty stable, how could these have driven house prices so much higher? • Not enough ability of demographic factors and the slow rate of house build to explain house price rises. • Great deal of weight placed on a credit constraint story for house price rises. • But difficult to create a consistent story if credit constraints are highly important for housing consumption but not for non-housing consumption, especially durables.
Or… • Very high real house prices (and/or low interest rates) are not regarded as long-term sustainable by the general public? • Also some distributional issues – since rapidly rising house prices (relatively) redistribute wealth from asset-poor to already asset-rich, from young to old. And this feeds subtle differences in aggregate consumption behaviour.
Mortgage Equity Withdrawal • 0% of household income in the late 1990s • Now over 8% today • Yet, consumption as a percent of household disposable income has hardly changed (1997-today) • What if MEW were to collapse this time? Source: Bank of England Inflation Report May 2004, p 13, Chart 2.4.
Correlation between annual house price inflation and annual consumption growth • 10 year rolling correlation coefficient has collapsed Source: Bank of England Inflation Report November 2004, p12 Chart B.
Need to correct for… • Demutualisation of building societies. Windfall payments (fungible with MEW) of £35 billion, or 7% of annual consumption, helped the jump from 90% to 96% in two years with hardly any change in MEW. • Introduction of self-assessment. • The relationship is still weaker than in the past but nevertheless is more positive than it first appears.
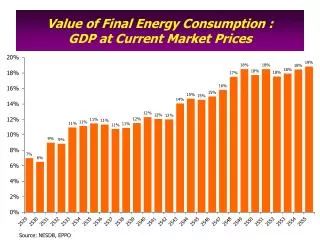
The big consumption story? • Levels v. stocks: The surge in the level of consumption from 86% to 96% of household disposable income created high rates of growth of consumption in the 1980s. • Recent consumption has run consistently at a much higher level for much of the last 7-8 years (with 3%-5% consumption growth per year). • The big consumption story of the late 1990s and early 2000s is the historically high level of consumption from disposable income, low levels of savings, and deteriorating pension provision.
More on MEW • Insignificant in the UK up to 1980. • 1980s liberalization. • No other country in the EU ever managed anywhere near to 8%. • 1979-1999 Germany, France, and Italy net injection of 6% of household income into housing. Source: Bank of England, Office for National Statistics and HM Treasury calculations. Chart 5.5, HMT 2004 p52, not updated.
Key MEW findings • 50%-60% is last-time sellers and those trading down, i.e. those most likely to pay off debt and save. • A large proportion that is spent goes on ‘home improvement’ and ‘new goods for the home’. • But, house prices and MEW are partly endogenous to any price bubble (family transfers, home improvement). • Borrowers who withdraw to spend are concentrated at higher incomes, but a sizeable proportion are on low incomes, and their borrowings are relatively high-level. • Low levels of serial remortgaging.
MEW and housing market Transactions • UK has one of the highest rates of housing market transaction in the EU. • Transactions volumes matter if most current MEW is released through last-time sales and trading down. Source: HMT Table 5.4, p51. Source: Bank of England and Office for National Statistics.
MEW cont. • MEW is more lumpy than many credit constraint stories suggest, which is why so much MEW is immediately saved and then generates a later flow. • Much of the consumption flow from recent MEW is still to come. More stabilizing? • If MEW plummets, there is no new flow into the stock of assets to generate new consumption flow. Less stabilizing? • In ‘turning’, or stagnant, housing markets price does not fall heavily at first; transactions do. The liquidity of the market and ability to ‘release’ equity falls.Those wanting to trade-down are heavily dependent on chains of buyers. Their ability to release MEW falls.
But… • Only element of MEW that seems not cyclical is remortgaging (but evidence is hard to interpret). • For those forms of MEW that involve borrowing…debt bites much more in a low inflation environment. • What if those borrowing on MEW are excessively buying into the house ‘price rise’? • If MEW replaces ‘more expensive’ forms of debt…this dries up if house prices fall. • A small consumption response can still be magnified by a big collapse in MEW. • If prices fall, there will be a collapse in MEW.
Demographics of MEW • Withdrawal of equity by last-time sellers is much greater than injection by first-time sellers. Stock of debt naturally rises over time. • If house prices are overvalued, those at the top have been removing more equity than they would have done in a less overvalued market, leaving behind on average more indebted households. • Price bubbles are highly redistributive. • Price bubbles are popular with voters, and politicians. • Element of being a ‘Ponzi’ game.
MEW is not the main storySavings and pensions are! • State of the housing market, level of savings, and ‘pensions crisis’ are linked. • Global liquidity story too. • If consumers believe that rapidly rising prices are sustainable…then they may believe that current consumption can be run at very much higher levels than in the past. • Shocking evidence of unrealistic price expectations. • (Case, K.E., Quigley, M., and Shiller, R.J. 2004) • Slack taken from other parts of the household balance sheet, and over-reliance on housing to generate future pensions provision.
What about non-MEW… • If many of those withdrawing housing equity are not immediately spending, what are non-MEW consumers doing to maintain consumption consistently at 96% or more of income? • Low savings; • Eating into pensions contributions they ‘should’ be making; • Non-MEW forms of debt; • Relying on house prices? Some notion of ‘asset value allusion’. Housing wealth fungible with other forms of savings? The cheapest form of credit?
Saving ratio • Shows UK households’ saving ratio and house prices (plotted with negative of saving ratio) • Paradox of thrift too in a major correction. Source: HMT 2004, Chart 6.3. p. 60. Source: Office for National Statistics and Office of the Deputy Prime Minister.
Saving ratio cont. • Correlation between saving ratio and house price inflation one period earlier Source: HM Treasury, 2004, p64.
Impact of interest rates on house prices and consumption • EITHER house prices are less volatile than in the past… • OR, if they are still just as volatile, the links to consumption are weaker… • OR, interest rates can cope with any problems (ease cash-flow problems, cushion/slow house price falls, etc.) • Direct and Indirect effects of interest rate changes via housing market: • both have forces working for and against; • Both are difficult to be precise.
Conclusions on direct and indirect effect • The direct effect of reducing interest rates after the last house price crash was large. Likely more modest today. • The Bank of England should worry less this time when raising (or holding high) interest rates, but also feel less confident of the power of rate cuts to make a big impact on aggregate cash-flow. • Indirect effect stronger, but not much interest rates can do if large speculative aspect to house prices. • But many caveats, including: • Distribution and fragility of debt is not fully clear. Caution; • Credit conditions generally; • Dangers of moral hazard if perceived to be ‘bailing out’.
Redistribution effects of falling/rising house prices • Rapid house price rises have similar consequences to sustained budget deficits, depressing the current real productive capital stock in exchange for current consumption by the gainers. • House price booms, just like government budget deficits, are popular with older consumers (and younger bubble-motivated consumer who ‘know no better’, or suffer asset price allusion). • Like deficits, older consumers benefit from the ‘borrowing’ from future generations, even as long-term income levels are reduced due to the crowding out of real productive capital stock.
Distributional issues suppressing long-run values • Depressing influences on the investment potential of housing of the current generation (since the market for the value of their homes is the next, smaller, more burdened generation) include: • demographically aging population; • falling cohorts in younger generations; • record low savings; • deteriorating provision for retirement; • the burden of social security and health increasing over time.
Still overvalued… • This and other analysis (risk premia, etc.) suggests the market is still overvalued. • Given current overvaluation, the real rate of return on housing for, say, the next 20 years is much lower than the historical average of about 2.5% (indeed, zero is within the 95% confidence interval for the 20 year real rate of return). • It also suggests that if correction is inevitable, it is not obvious that correction should be resisted.
Global House price correlations and global liquidity • Highly synchronized positive movements in house prices, and global build up in mortgage debt. • An extremely recent phenomenon that does not affect all countries equally: • US, Australia, UK, China, France, Ireland, New Zealand, South Africa; • Relatively few EU countries. • The correlation between real house prices and output (and consumption) has declined since the mid-1990s, reaching unprecedented low levels by 2003. • Potential for instability from outside UK • Hence issues of timing, interest rate decisions, etc.
Variance decomposition of house prices Source: IMF 2004, data from: Haver Analytics; IMF, International Financial Statistics; national sources; OECD; and IMF staff calculations.
UK case • House Factor and Global Factor over time, per cent change, constant prices, demeaned Source: IMF 2004, data from: Haver Analytics; IMF, International Financial Statistics; national sources; OECD; and IMF staff calculations.
UK decomposition of house price change over time • Orange = Actual • Blue = Global Housing Factor • Red = Global Factor • Black = Country Factor Source: Extracted from IMF 2004
Global Liquidity • Global driving forces – especially US house prices, US interest rates, and global liquidity. • 25% per year growth in the sum of America’s cash and banks’ reserves held at the Fed, and in the foreign reserve holdings of central banks around the world. • Excess liquidity in the past flowed into traditional measures of inflation (goods and service prices). • Does extreme liquidity show up in asset price inflation – house prices – and record high global levels of debt, especially mortgage debt? Overreaction after stock market crash? • US housing stock has risen in paper value by $5 trillion, almost precisely matching the $5trillion of lost stock market wealth of the early 2000s.
Did Global interest rates go too low? • Natural rate of interest: the rate at which the supply of savings of households exactly balances the demand for funds by firms for investment purposes. • Natural rate is roughly equal to the rate of inflation plus the real trend rate of growth. • Natural rate moves about according to: • technological improvement; • changes in preferences; • the impact of demographics on the need for savings, etc. • If cost of capital set below this, get overcapitalization, the level of borrowing and investment will be excessive, saving too low, and the chances of bubbles greater.
Natural rate too low, continued • For UK about 5% (2% inflation plus 2% to 3%). • Global natural rate (difficult to work out precisely) may even have risen (China, IT, global integration, inflation success, etc.). • Yet, some of these forces have also lowered inflation and even encouraged lower interest rates. • And bubbles encourage households not to save, making things worse. • Low rates followed collapse of late 1990s and various other crises/collapsing bubbles.
The US • US (especially) interest rate kept below ‘natural rate’ for too long? 3% to 5% too low? Maybe after previous bubbles? Went from 6.5% in 2001 to 1% in 2003. • Past five years America’s national spending has exceeded its income by about a fifth. • Private debt has boomed (nearly $10trillion). • Savings have hit 0.5% (compared to historical average of 8%). Sometime, a reversion back to 8%? • Private debt service is historically high – even before interest rates rise.
US cont. • US government has joined US citizens. Approx $450bn budget deficit per year. • Externally held portion of debt risen from 20% to 45%. • Problems with ‘depth’ of US mortgage markets. • Problems with US ‘lender of last resort’.
US cont. • If a country has strongly favourable investment opportunities – that will ultimately make its inhabitants much better off – it is economically rational to consume some of the fruits now, borrow from the rest of the world, and repay from higher output later. • Meanwhile, run a strong currency and high trade and current account deficits that generate a net capital flow equal to the current account deficit. • However, decomposition of US data shows that debt is currently largely being used to finance public and private consumption, rather than investment.
Asia and US mutually reinforce • Global foreign exchange reserves have doubled since the Asian crisis of 1998, to $3,800bn, with two-thirds of this in dollars. Asia accounts for 80% of this growth and now has 70% of global reserves. • Reserves account for 9% of global gross domestic product, compared to less than 2% during the pre-1971 Bretton Woods era. • High demand for US debt may be a response to previous crises. It has chipped 0.5% to 1% off US yields. It has helped the US to run large government and trade deficits. • China has chipped 0.1% to 0.3% of US inflation (maybe as much as 1%). • In turn, China’s boom has been helped by low US rates.
House price contagion? • If sufficiently strong house price falls in one country (for example, rebalancing in the US will require lower spending on housing consumption) or several countries generate a decline in consumption for them, then it is more likely that consumption will fall in other countries too: • Real contagion (via consumption). • Financial contagion (via, in particular, mortgage bank and government balance sheets). • Equity-based bubbles less damaging than debt-based bubbles. Has mitigating the first, led to the latter? • See Farlow, “UK House Prices, Consumption, and GDP in a Global Context,” Section 6, for scenarios for correction.
Impact on UK policy • How do these possibilities affect our attitude to falling house prices in the UK and central bank policy on interest rates? • If rebalancing of the UK housing market is inevitable, this suggests allowing rebalancing to proceed sooner rather than later – leaving the housing market in a better position to withstand global disturbances consequent on rebalancing elsewhere. • Reversion to fundamentals, while it harms consumption, at least conceivably puts the economy back on a footing that emphasizes real economic activity over speculative housing activity and ends the distortions that lead to long-term pension and saving misallocation.
Lessons for the UK • Global instability might matter more for UK house prices than is perhaps currently accepted. The fate of the UK housing market may currently be one of the less domestically controllable aspects of UK macroeconomics. • The Bank of England has faced an unenviable choice between trying to turn the tide of house prices and not sacrificing growth and risking under-hitting its inflation target. • Emphasis on controlling the housing market has to include reforms and not just rely on interest rates.
Lessons for UK cont. • Interest rates may have little power to influence house prices in a price collapse anyway. Trying to generate a cash-flow affect to offset a wealth effect caused by an unwinding bubble may simply not work very well. • Handling global surges in house prices might need more of a coordinated response than it probably gets, or is ever likely to get. • Stop-go cycle via house prices in place of stop-go cycle via goods and services prices?
Bubbles confuse inflation signals • Recent asset price bubbles might have helped to dampen up-front inflationary pressures. In case of equity market bubbles: • Artificially boost profits as measured in standard accountancy measures – firms adopt more aggressive pricing strategies; • Positive feedback via capital accumulation and favourable supply-side developments, especially productivity gains, the spreading of technology, and ‘catch up’ in emerging economies (c.f. China), with consequent lower inflationary pressure; • Firms able to make much lower contributions to pension schemes (and employees willingly accept, c.f. US 1990s); • Employees tolerate less inflationary wage claims given perceived gains on stock market investments (especially evident in the US in the late 1990s);
Bubbles confuse signals, cont. • Governments benefit from bubble-inflated asset prices that inflate the tax yield (stock market taxes at the end of the 1990s, housing transactions taxes, consumption taxes, low use of pension tax allowances, etc. in current housing bubble) and allow them to run lower tax rates than otherwise would be the case, even as their fiscal positions are strengthened; • When the bubbles unwind, all these things go into reverse – just at the wrong time.