Download
1 / 29
290 likes | 374 Views
Collaborative study shedding light on the evolution of galaxies in clusters, cluster detection methods, and selection functions around redshift 1. Insights into star formation, galaxy assembly, population changes, and cluster mass impact.

E N D
Discovery of Galaxy Clusters Around Redshift 1 Deborah Haarsma, Calvin College @ GLCW, June 1, 2007
Collaborating with Calvin College: students Andrew Butler, Katie Shomsky Michigan State University: Megan Donahue, Mark Voit, Ming Sun, student Seth Bruch National Optical Astronomy Observatory: Mark Dickinson Space Telescope Science Institute: Marc Postman Lawrence Berkeley National Laboratory: Greg Aldering European Southern Observatory: Piero Rosati University of Colorado: John Stocke
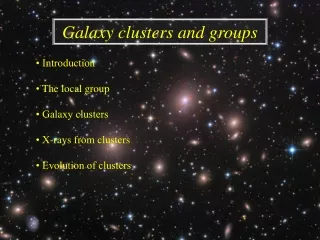
Insights into galaxy evolution from clusters • When did stars form? Single burst or long timescale? How did star formation stop? (gas stripping? winds? mergers? AGN feedback?) • How and when did galaxies assemble into clusters? Reconciling “down-sizing” with hierarchical structure formation. • How are galaxy populations in clusters still changing? Dry mergers, evolution of luminosity function. • How do the answers to these questions depend on the mass of the cluster? The density of the intracluster medium? Field vs. cluster populations? Need more z>0.8 clusters Need more x-ray luminous clusters RDCS 1252.9-2927 at z=1.24 Rosati et al 2004 AJ 127, 230 Contours = x-ray (Chandra+ROSAT) Image = B R K filters
ROSAT Optical X-ray Survey (ROXS) Goal is not just finding clusters, but understanding cluster detection methods and selection functions • 4.8 sq deg • ROSAT X-ray data and Kitt Peak I-band data of whole field • “wavelet” method (Rosati) to detect extended X-ray sources • “matched filter” method (Postman) to detect concentrations of optical galaxies of appropriate brightness
ROSAT Optical X-ray Survey (ROXS) • A bimodal population? • More likely these are lower mass clusters, with x-ray emission below detection limit (Donahue et al 2001 ApJ 552, L93) 142 clusters detected in optical 43 clusters detected in X-ray 112 detected in optical but not in X-ray
ROSAT Optical X-ray Survey (ROXS) Three options: • A real cluster at z>1, failed to detect in optical due to I-band drop outs • A real cluster at moderate z, failed to detect in optical due to poorness or extent (predicted for none with z<0.4) • A constellation of X-ray point sources (predicted for 10% of the 43 X-ray sources) 142 clusters detected in optical 43 clusters detected in X-ray 13 detected in X-ray but not in optical
Bimodality of color-magnitude relation ~75% ellipticals and SOs Color Red sequence Blue Cloud ~75% spirals Magnitude Coma Cluster, z=0.023DeLucia et al, astro-ph/0610373 I-band magnitude
Observations • April 2005, KPNO 4-meter • FLAMINGOS camera, 10' field of view • 10 fields observed, containing 11 x-ray sources • 2.5 hour/field in J filter (1.2 μm), 1 hour/field in Ks filter (2.2μm) • Observations by Megan Donahue, Mark Dickinson, and Greg Aldering • Data reduction by Andrew Butler (Calvin undergrad) and Seth Bruch (then a UWisc undergrad)
Red sequence detections z~1.4 z~1.0 z~1.0 z~0.9 z~0.8 z=0.338, no I-band data z~1.0 z~0.9, no I-band data
Evidence for redshifts around 1 • I-band dropout (redshifted enough to be faint in I-band) • J-K color consistent with models
Evidence for redshifts around 1 • I-band dropout (redshifted enough to be faint in I-band) • J-K color consistent with models • J-K color consistent with other clusters 0.8<z<1.2 • Brightness of BCG consistent with other clusters 0.8<z<1.2 • Colors redder than field galaxy population + Our clusters o Clusters in literature with spectroscopic redshifts 0.8<z<1.2
RXJ 1606.1+2558 • z~0.8 Color image: IJK filters Small circles: red sequence members Contours: ROSAT x-ray
RXJ 1605.6+2548 • z~0.9 • Similar color to field galaxies Color image: IJK filters Small circles: red sequence members Contours: ROSAT x-ray
RXJ 1205.2+2752 • z~1.0 • Two subclusters merging? Color image: IJK filters Small circles: red sequence members Contours: ROSAT x-ray
RXJ 1603.6+4316 • z~1.0 • Supercluster in field at z=0.9 Color image: IJK filters Small circles: red sequence members Contours: ROSAT x-ray
RXJ1416.3 Color image: IJK filters Small circles: red sequence members Contours: ROSAT x-ray • z~1
RXJ 1118.9+2117 • z~1.3 • High-z interaction? separation ~20kpc Color image: IJK filters Small circles: red sequence members Contours: ROSAT x-ray
ROSAT Optical X-ray Survey (ROXS) Three options: • A real cluster at z>1, failed to detect in optical due to I-band drop outs • A real cluster at moderate z, failed to detect in optical due to poorness or extent (predicted for none with z<0.4) • A constellation of X-ray point sources (predicted for 10% of the 43 X-ray sources) 142 clusters detected in optical 43 clusters detected in X-ray 13 detected in X-ray but not in optical
XMM archive data • 5 of 6 fields had observations in archive, 10-40ks • Analyzed by Ming Sun • Not sufficient depth to detect extended emission (cluster x-ray luminosities 1043-1044erg/s at z=0.8-1.0 would be below 5 sigma detection limit) • In all 5 cases, one or more point sources detected
RXJ1416.3: Extended ROSAT source resolved by XMM into two point sources XMM Grey: K-band Contours: ROSAT X-ray
RXJ1603: Extended ROSAT source resolved by XMM into point sources XMM Grey: K-band Contours: ROSAT X-ray
ROSAT Optical X-ray Survey (ROXS) Three options: • A real cluster at z>1, failed to detect in optical due to I-band drop outs • A real cluster at moderate z, failed to detect in optical due to poorness or extent (none predicted for z<0.4) • A constellation of X-ray point sources (predicted for 10% of the 43 X-ray sources) 142 clusters detected in optical 43 clusters detected in X-ray 13 detected in X-ray but not in optical
Conclusions • Matched filter method reliably detects low and moderate redshift optical clusters using single filter • Near infrared colors are effective for detecting z~1 clusters • Clusters can have multiple X-ray AGN. Good X-ray resolution essential for separating intracluster medium emission from AGN emission. • Find 4 to 6 new clusters, estimated redshift 0.8-1.3 (but without luminous intracluster medium) • Follow-up plans: • Gemini spectroscopy to get firm cluster redshift – IN PROGRES • Spitzer imaging for photometric redshifts, identify cluster members • Measure blue fraction (Butcher-Oemler effect), K-band luminosity function, slope & scatter of red sequence • HST imaging to classify galaxy morphologies, morphology-density relation • VLA imaging to study AGN
Flux and color calibration • Calibrated to Persson standard stars observed on same night • Checked with 2MASS stars observed in same field • Final correction using color of M-dwarf stars observed in same field
Cluster detection • Optical could be 1' or more from X-ray center due to wide ROSAT PSF and registration • Yet cluster radius is only ~20" at z=1 (0.25h50-1 Mpc) • So, require at least 4 objects of similar color, in circle 25" radius, located within 1.5' of x-ray
RXJ1416.3 Color image: IJK filters Small circles: red sequence members Contours: ROSAT x-ray • z~1
Cluster detection • Check random spots in field with same algorithm, find red sequences at 18% of locations. • Detect either: • concentrations of field galaxies • real clusters with faint intracluster medium (ROSAT constellations)