Download
1 / 16
160 likes | 263 Views
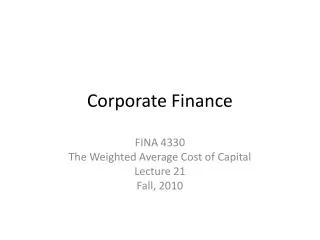
Corporate Finance. FINA 4330 The Weighted Average Cost of Capital Lecture 21 Fall, 2010. Cost of Capital. r s = r o + (r o -r B )B/S. WACC = r o. r. r B. Cost of Capital (After Tax). r s = r o + (r o -r B )(1-T)B/S. r. WACC = r 0 (1-T(D/v)) = r s (S/V) + r B (1-T) (B/V). r B.

E N D
Corporate Finance FINA 4330 The Weighted Average Cost of Capital Lecture 21 Fall, 2010
Cost of Capital rs = ro + (ro -rB)B/S WACC = ro r rB
Cost of Capital (After Tax) rs = ro + (ro-rB)(1-T)B/S r WACC = r0(1-T(D/v)) = rs(S/V) + rB(1-T)(B/V) rB
The two ways of representing firm value V = V (u) + T * BV = SY(1-T)(1+WACC)tWhere,WACC = r0 = rs (S/V) + rB (1-T)(B/V)
Static Tradeoff Theorem • Costs of Financial Distress (“Contracting Costs”) • Potential Bankruptcy Costs • Underinvestment • Risk Shifting • Agency Costs • Assume: • Not Taxes • Risk neutrality • Single period • Interest rate = 0%
Example of Underinvestment ASSETS PVA $1,000,000 PVGO 2,000,000 TOTAL $3,000,000 LIABILITIES DEBT 2,500,000 EQUITY 500,000 TOTAL $3,000,000
Example of Underinvestment ASSETS PVA $1,000,000 PVGO 2,000,000 TOTAL $3,000,000 LIABILITIES DEBT 2,500,000 EQUITY 500,000 TOTAL $3,000,000
Example of Underinvestment ASSETS PVA $1,000,000 (Cash = 600,000) (Real Assets = 400,000) PVGO 2,000,000 TOTAL $3,000,000 LIABILITIES DEBT 2,500,000 EQUITY 500,000 TOTAL $3,000,000
Example of Underinvestment Make a Div Payment rather than invest ASSETS PVA $400,000 (Real Assets = 400,000) PVGO 2,000,000 TOTAL $2,400,000 LIABILITIES DEBT 2,250,000 EQUITY 1 50,000 TOTAL $2,400,000
Risk Shifting • Suppose the firm has value that will look like the following: • Value in Good State = $4,500,000 • Value in Bad State = 1,500,000 • With equal probability • Promised payment to the Bondholder: $3,500,000 What is the value of the equity and the debt?
Investment Opportunity • Invest $1,000,000 to generate: $1,500,000 with probability ½ in good state, 0 otherwise, so that New cash flows are: $5,000,000 in good state 500,000 in bad state: What is the NPV of the project, value of the debt and value of the equity?
Firm Value Costs of Financial Distress V = V(u) + PV of Tax Shield Debt Level Optimal Debt Level
Pecking Order Hypothesis • Costly Information • Conclusion • Firm has an ordering under which they will Finance • First, use internal funds • Next least risky security
Intuition • Suppose that you know your firm is undervalued, and you want to invest in a project: How do you finance it? • Now suppose you believe the firm is overvalued
Pecking Order theory • So you have a dominating way of getting capital • Internal Financing • Risk free debt • Risky debt • Equity In general, the more “debt like” a security is, the more you want to issue it.
So the announcement effect • If the firm announces it intends to issue equity to invest in a project, this is bad news and stock prices will go down. That is the market will ASSUME this is a bad firm. • Therefore the firm will never issue equity if it can avoid it. • Thus pecking order.