Download
1 / 8
80 likes | 260 Views
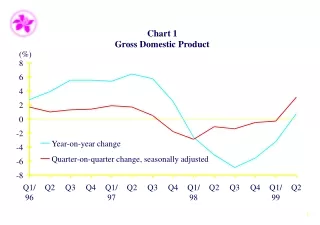
Examining the Drivers of Readmissions and Reducing Unnecessary Readmissions for Better Patient Care September 2011. Unplanned readmissions related to the initial stay likely offer the best opportunity for savings and care improvements. Chart 1: A Framework for Classification of Readmissions.

E N D
Examining the Drivers of Readmissions and Reducing Unnecessary Readmissions for Better Patient CareSeptember 2011
Unplanned readmissions related to the initial stay likely offer the best opportunity for savings and care improvements. Chart 1: A Framework for Classification of Readmissions Source: American Hospital Association.
Risk-adjusted readmission rates do not account for some factors that may influence risk of readmission. Chart 2: Risk Adjustment Variables for 30-day, All-cause Risk Standardized Readmission Rate Following Pneumonia Hospitalization Source: National Quality Forum. Measure # 0506. www.qualityforum.org. Note: CABG=coronary artery bypass graft; ESRD=end stage renal disease; CHF=congestive heart failure; and COPD=chronic obstructive pulmonary disease.
There appears to be an inverse relationship between mortality and readmissions. Chart 3: Percentile Rankings of Adjusted Mortality and 30-day Readmission Rates, States with the Lowest and Highest Adjusted Mortality Rates Low Mortality States High Mortality States Source: Analysis by Greater New York Hospital Association, 2009. Note: Findings based on CMS’ Hospital Compare data released on July 7, 2009. Chart shows 11 states with lowest and 12 states with highest adjusted mortality rates. MD was omitted from the low mortality states because readmissions data were not available.
The more chronic conditions a patient has, the greater the likelihood of readmission. • Chart 4: 30-day Readmission Rate for Non-dual, Disabled Medicaid Beneficiaries by Number of Chronic Illness and Disability Categories 30-day Readmission Rate Source: Gilmer, T., and Hamblin, A. (December 2010). Hospital Readmissions among Medicaid Beneficiaries with Disabilities: Identifying Targets of Opportunity. New Jersey: Center for Health Care Strategies. Note: Number of chronic illnesses and disabilities measured using Chronic Illness and Disability Payment System (CDPS), a risk adjustment model used to adjust capitated payments to health plans that enroll Medicaid beneficiaries. Study included 941,208 Medicaid beneficiaries hospitalized from 2003-2005 in 50 states and DC.
Medicaid beneficiaries are consistently at greater risk of readmission than privately insured adults. • Chart 5: Non-obstetric, Adult 30-day Readmission Rates by Insurance Coverage and Number of Co-morbidities, 2007 Source: Jiang, H.J., and Wier, L.M. (April 2010). All-cause Hospital Readmissions among Non-elderly Medicaid Patients, 2007. HCUP Statistical Brief #89. Rockville, MD: Agency for Healthcare Research and Quality.
The effect of socioeconomic factors raises questions about using readmissions to measure quality. Chart 6: Community Characteristics and Hospital Quality Measures for a Suburban and an Urban Community Source: Bhalla, R., and Kalkut, G. (2010). Could Medicare Readmission Policy Exacerbate Health Care System Inequality? Annals of Internal Medicine, 152(2), 114-117. Note: HF=Heart Failure.
Hospital efforts to enhance discharge planning and follow-up care can help reduce readmissions. Chart 7: Cumulative Hazard Rate* of Hospital Utilization for 30 Days Post Discharge, Patients Receiving Usual Care vs. Patients Receiving Discharge Intervention Source: Jack, B.W., et al. (2009). A Reengineered Hospital Discharge Program to Decrease Rehospitalization: A Randomized Trial. Annals of Internal Medicine, 150(3), 178-187. *The cumulative hazard rate is the cumulative number of hospital utilization events over total discharges over 30 days and illustrates how the risk of hospital utilization changes over time for each group. Note: Hospital utilization is defined as a readmission or ED visit within 30 days. Intervention consisted of patient education, discharge planning, and follow-up phone call. Results statistically significant at p=0.004.