Download
1 / 24
360 likes | 1.81k Views
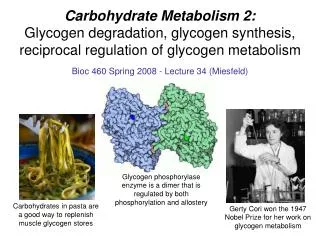
Regulation of Glycogen Metabolism. Protein Kinases Protein Phosphatases cAMP G proteins Calcitonin Insulin, glucagon, and epinephrine. Consider. A B. C. Biochemical Definitions.

E N D
Regulation of Glycogen Metabolism • Protein Kinases • Protein Phosphatases • cAMP • G proteins • Calcitonin • Insulin, glucagon, and epinephrine
Consider A B C Biochemical Definitions 1. Equilibrium: (Kinetics) When the rate of the forward reaction matches the rate of the reverse reaction. Does not specify quantity at equilibrium. 2. Equilibrium constant: (Thermodynamics) The quantity [B]/[A] at equilibrium. Does not specify rate. 3. Flux: Net carbon flow in one direction 4. Steady-state: A dynamic condition that allows flux without changing the concentration of components in the pathway.
pH = 7.0 (10-7 M [H+] ) ∆Go = RT ln Keq ’ Connecting Kinetics with Thermodynamics Chemistry ∆Go = RT ln Keq Biochemistry
A B ∆Go = RT ln Keq ’ [B]/[A] ∆Go’ (kJ/mol) Practically Speaking….. 1. A negative ∆Go’ means [P] > [S] at equilbrium. 2 -1.8 10 -5.9 100 -11.9 1,000 -17.8 10,000 -23.7 100,000 -29.7
B A B A Steady-State vs Equilibrium Reactions Rule: An equilibrium reaction occurs in a closed system whereby two components, a reactant and a product, achieve a constancy of concentration based on chemical potentials Rule: A steady-state reaction occurs in an open system whereby two or more components achieve a constancy of concentration based on similar rates of components entering and leaving the system See Strategies p 163-167 Y Z
k1 k2 A k1 k2 When A is constant = A decreases k1 k2 When < k1 k2 When A increases > Representing a Steady-State A A A
Basics of Metabolic Homeostasis Rule: A shift away from a dynamic steady-state evokes factors to restore the steady-state. Rule: Restoring steady-state requires modulating the activity of a rate-controlling enzyme(s) in the pathway Enzyme activity can be modulated by: 1. Covalent modification 2. Changes in pathway [S] or enzyme cofactors 3. Allosterism (Vmax or Km) 4. Hormonal intervention 5. Enzyme turnover
A B C D Rate-determining Regulation of Carbon Flux • Net carbon flux through an individual step in a pathway is defined as the difference between the forward and reverse reaction velocities J = VF - VR (these are rates of change) • At equilibrium: VF= VR; J = 0; i.e., there is no net flux even though VF and VR could be large • When VF >> VR, J = VF • At steady state, J = k (constant) • At steady state, J depends on the rate determining (slowest) step in the pathway Textbook p591
Meaning of Flux Glucose J = 0 Rate-controlling Step VF > VR Lactate
A A B A B A B A Flux varies with equilibrium position A • If [A] = 100mM; [B] = 10mM, an increase in [A] by 10 mM • would increase flux would by 10%. (from 10:1 to 11:1) • If [A] = 20mM; [B] = 10mM, an increase in [A] by 10 mM • would increase flux by 33% . (2:1 to 3:1) • If [A] = 10mM; [B] = 10mM, an increase in [A] by 10 mM • would increase flux by 100% (1:1 to 2:1).
Rule: Regulators with the lowest steady-state concentration have the greatest impact on regulation AMP (0.1 mM) ATP (5 mM) ADP (1 mM) Adenylate Kinase 2ADP = AMP + ATP ATP + X ATP + X~P + ADP 5 0.5 4.5 0.5 0.5 ATP + AMP 2ADP 0.5 0.5 0.5 Final Talley: Before After ATP 5 mM 5 mM No change ADP 1 mM 1 mM No change AMP 0.1 mM 0.6 mM 6 times
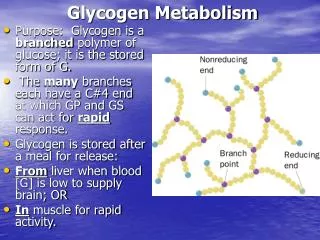
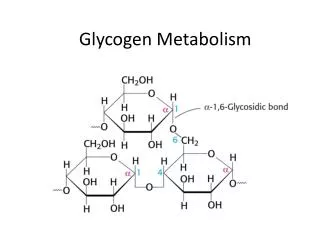
Glycogen Glycogen Phosphorylase Synthase Glycogenase UDP-Glucose Glucose 1-PO4 Glucose 1-PO4 Why are there 2 enzymes in glycogen metabolism? How can glycogen synthesis and degradation be tuned to the needs of the cell? Only glycogen or glucose 1-PO4 concentration can affect VF or VR Because separate enzymes control synthesis and degradation, VF and VR can vary depending on the enzyme that controls the direction. This opens the way to allosteric and covalent control of glycogen Stimulating or inhibiting the enzyme cannot control direction of flux
ADP ADP Syn b Phos a Pkinase Ptase Ptase Syn a ATP Phos b ATP PO4 PO4 cAMP ATP cAMP as a Regulator of Glycogen Pkinase Protein Kinase targets of cAPK cAMP Protein kinase (cAPK) Adenyl cyclase Glucagon Epinephrine Textbook p586
cAMP C R cAMP R R + 4 cAMP + cAMP C C C R cAMP cAPK Calmodulin Inactive Kinase C 2ATP 2ADP Active Kinase Catalytic site P P cAMP Protein kinase (cAPK) Now its ready to phosphorylate phosphorylase b Example would be phosphorylase b kinase
Priming phosphate ADP H2O B Glycogen Synthase PP1 P P P P 3Pi A ATP Inactivation of Glycogen Synthase Inactive Casein kinase II (primer) Glycogen synthase kinase 3 (GSK3)
ADP ADP Syn b Phos a Pkinase Pkinase PP1 PP1 Syn a ATP Phos b ATP PO4 PO4 Phosphorylase Kinase a ADP H2O cAPK PP1 ATP Phosphorylase Kinase b PO4 Phosphoprotein Phosphatase-1 (PP1) Remember, this is the “stripper” enzyme. It takes “off” phosphate groups on proteins
Insulin stimulates glycogen synthesis in liver and muscle by blocking the action of GSK3 and activating PP1 Glycogen Synthase a Glycogen Synthase b P P P X X Insulin 3 ATP 3 ATP GSK3 CKII ATP Inactive Active 3Pi PP1 Insulin Glucose Text p586 Glucagon epinephrine Glucose- 6-phosphate
Phosphoprotein Phosphatase-1 (Muscle) ADP OH P P P ATP OH Glycogen Glycogen G subunit G subunit ATP PP1 PP1 ADP OH 2ATP Glycogen PP1 G subunit + Inhibitor 2ADP P Insulin (site 1 phosphorylation) Insulin-stimulated protein kinase more active Glycogen synthesis stimulated, breakdown blocked K1 Epinephrine, glucagon (site 2 phosphorylation) K2 Glycogen Breakdown stimulated, synthesis blocked cAPK Less active K2 (site 1 and 2 phosphorylation) inactive Text p588
Insulin regulation of GSK3 Shut down of GSK3 by PKB Text p 587
Summary of Catabolic Hormonal Effects on Glycogen • Glucagon and Epinephrine stimulate synthesis of cAMP • cAMP activates phosphorylase b kinase that converts phosphorylase b to phosphorylase a • Phosphorylase a breaks down glycogen at an accelerated rate • cAMP also inactivates PP1, prolonging the action of phosphorylase a
Summary of Anabolic Effects on Glycogen • Insulin activates glycogen synthase by stimulating phosphorylation of GDK3 • GDK3 inactivates itself allowing phosphoprotein phosphatase (PP1) to remove phosphate and activate glycogen synthase • PPI also removes phosphate from phosphorylase a thereby shutting off glycogen breakdown
Phosphorylase kinase cAMP dependent protein kinase Phosphorylase Adenylcyclase R R C C P P See Tutorial on cAMP-dependent Protein Kinases available on the web
P P P P Phosphoprotein phosphatase-1 5’-AMP Low glucose a form (R state) is resistant to phosphatase High glucose a form (T state) is vulnerable to phosphatase Liver Text p446-447 R State T State Glucose Phosphorylase a High Glucose Low Glucose + Phosphorylase b Binds weakly to b form Active
Summary of Phosphoprotein Phosphatase-1 (Liver) 1. The Phosphatase binds to phosphorylase a (T or R form) (It does not bind to glycogen or a G protein) 2. The T form has a serine exposed to allow hydrolysis of -PO4 3. The R form of phosphorylase a -PO4 cannot be hydrolyzed 4. Glucose converts R to T form which causes hydrolysis of -PO4 and dissociate the Phosphatase. (glucose is an allosteric effector of phosphorylase in liver) 5. The liberated Phosphatase is free to activate glycogen synthase, thereby stimulating glycogen synthesis