Download
1 / 56
930 likes | 1.53k Views
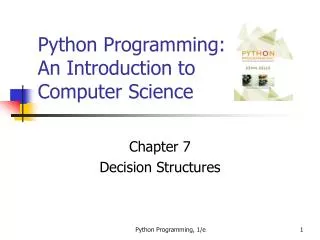
Intro to Pattern Recognition : Bayesian Decision Theory. 2. 1 Introduction 2.2 Bayesian Decision Theory – Continuous Features. Materials used in this course were taken from the textbook “Pattern Classification” by Duda et al., John Wiley & Sons, 2001

E N D
Intro to Pattern Recognition :Bayesian Decision Theory 2. 1 Introduction 2.2 Bayesian Decision Theory–Continuous Features Materials used in this course were taken from the textbook “Pattern Classification” by Duda et al., John Wiley & Sons, 2001 with the permission of the authors and the publisher
Credits and Acknowledgments • Materials used in this course were taken from the textbook “Pattern Classification” by Duda et al., John Wiley & Sons, 2001 with the permission of the authors and the publisher; and also from • Other material on the web: • Dr. A. Aydin Atalan, Middle East Technical University, Turkey • Dr. Djamel Bouchaffra, Oakland University • Dr. Adam Krzyzak, Concordia University • Dr. Joseph Picone, Mississippi State University • Dr. Robi Polikar, Rowan University • Dr. Stefan A. Robila, University of New Orleans • Dr. Sargur N. Srihari, State University of New York at Buffalo • David G. Stork, Stanford University • Dr. Godfried Toussaint, McGill University • Dr. Chris Wyatt, Virginia Tech • Dr. Alan L. Yuille, University of California, Los Angeles • Dr. Song-Chun Zhu, University of California, Los Angeles
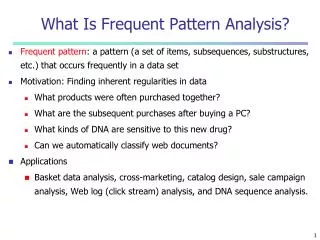
Sorting Fish: incoming fish are sorted according to species using optical sensing (sea bass or salmon?) • Problem Analysis: • set up a camera and take some sample images to extract features • Consider features such as length, lightness, width, number and shape of fins, position of mouth, etc. Feature Extraction Segmentation Sensing TYPICAL APPLICATIONS IMAGE PROCESSING EXAMPLE
TYPICAL APPLICATIONS LENGTH AS A DISCRIMINATOR • Length is a poor discriminator
TYPICAL APPLICATIONS ADD ANOTHER FEATURE • Lightness is a better feature than length because it reduces the misclassification error. • Can we combine features in such a way that we improve performance? (Hint: correlation)
TYPICAL APPLICATIONS WIDTH AND LIGHTNESS • Treat features as a N-tuple (two-dimensional vector) • Create a scatter plot • Draw a line (regression) separating the two classes
TYPICAL APPLICATIONS WIDTH AND LIGHTNESS • Treat features as a N-tuple (two-dimensional vector) • Create a scatter plot • Draw a line (regression) separating the two classes
TYPICAL APPLICATIONS DECISION THEORY • Can we do better than a linear classifier? • What is wrong with this decision surface? (hint: generalization)
TYPICAL APPLICATIONS GENERALIZATION AND RISK • Why might a smoother decision surface be a better choice? (hint: Occam’s Razor). • This course investigates how to find such “optimal” decision surfaces and how to provide system designers with the tools to make intelligent trade-offs.
Real data is often much harder: • Degrees of difficulty: TYPICAL APPLICATIONS CORRELATION
Thomas Bayes • At the time of his death, Rev. Thomas Bayes (1702 –1761) left behind two unpublished essays attempting to determine the probabilities of causes from observed effects. Forwarded to the British Royal Society, the essays had little impact and were soon forgotten. • When several years later, the French mathematician Laplace independently rediscovered a very similar concept, the English scientists quickly reclaimed the ownership of what is now known as the “Bayes Theorem”.
BAYESIAN DECISION THEORY PROBABILISTIC DECISION THEORY • Bayesian decision theory is a fundamental statistical approach to the problem of pattern classification. • Quantify the tradeoffs between various classification decisions using probability and the costs that accompany these decisions. • Assume all relevant probability distributions are known (later we will learn how to estimate these from data). • Can we exploit prior knowledge in our fish classification problem: • Are the sequence of fish predictable? (statistics) • Is each class equally probable? (uniform priors) • What is the cost of an error? (risk, optimization)
BAYESIAN DECISION THEORY PRIOR PROBABILITIES • State of nature is prior information • Model as a random variable, : • = 1: the event that the next fish is a sea bass • category 1: sea bass; category 2: salmon • P(1) = probability of category 1 • P(2) = probability of category 2 • P(1) + P( 2) = 1 • Exclusivity: 1 and 2 share no basic events • Exhaustivity: the union of all outcomes is the sample space (either 1 or 2 must occur) • If all incorrect classifications have an equal cost: • Decide 1 if P(1) > P(2); otherwise, decide 2
Given a feature, x (lightness), which is a continuous random variable, p(x|2) is the class-conditional probability density function: BAYESIAN DECISION THEORY CLASS-CONDITIONAL PROBABILITIES • A decision rule with only prior information always produces the same result and ignores measurements. • If P(1) >> P( 2), we will be correct most of the time. • Probability of error: P(E) = min(P(1),P( 2)). • p(x|1) and p(x|2) describe the difference in lightness between populations of sea and salmon.
BAYESIAN DECISION THEORY PROBABILITY FUNCTIONS • A probability density function is denoted in lowercase and represents a function of a continuous variable. • px(x|), often abbreviated as p(x), denotes a probability density function for the random variable X. Note that px(x|) and py(y|) can be two different functions. • P(x|) denotes a probability mass function, and must obey the following constraints: • Probability mass functions are typically used for discrete random variables while densities describe continuous random variables (latter must be integrated).
BAYESIAN DECISION THEORY BAYES FORMULA • Suppose we know both P(j) and p(x|j), and we can measure x. How does this influence our decision? • The joint probability that of finding a pattern that is in category j and that this pattern has a feature value of x is: • Rearranging terms, we arrive at Bayes formula: where in the case of two categories:
BAYESIAN DECISION THEORY POSTERIOR PROBABILITIES • Bayes formula: can be expressed in words as: • By measuring x, we can convert the prior probability, P(j), into a posterior probability, P(j|x). • Evidence can be viewed as a scale factor and is often ignored in optimization applications (e.g., speech recognition).
Two-class fish sorting problem (P(1) = 2/3, P(2) = 1/3): BAYESIAN DECISION THEORY POSTERIOR PROBABILITIES • For every value of x, the posteriors sum to 1.0. • At x=14, the probability it is in category 2 is 0.08, and for category 1 is 0.92.
BAYESIAN DECISION THEORY BAYES DECISION RULE • Decision rule: • For an observation x, decide 1 if P(1|x) > P(2|x); otherwise, decide 2 • Probability of error: • The average probability of error is given by: • If for every x we ensure that P(error|x) is as small as possible, then the integral is as small as possible. Thus, Bayes decision rule for minimizes P(error).
BAYESIAN DECISION THEORY EVIDENCE • The evidence, p(x), is a scale factor that assures conditional probabilities sum to 1: P(1|x)+P(2|x)=1 • We can eliminate the scale factor (which appears on both sides of the equation): • Decide 1 if p(x|1)P(1) > p(x|2)P(2) • Special cases: if p(x| 1)=p(x| 2): x gives us no useful information if P(1) = P(2): decision is based entirely on the likelihood, p(x|j).
CONTINUOUS FEATURES GENERALIZATION OF TWO-CLASS PROBLEM • Generalization of the preceding ideas: • Use of more than one feature(e.g., length and lightness) • Use more than two states of nature(e.g., N-way classification) • Allowing actions other than a decision to decide on the state of nature (e.g., rejection: refusing to take an action when alternatives are close or confidence is low) • Introduce a loss of function which is more general than the probability of error(e.g., errors are not equally costly) • Let us replace the scalar x by the vector x in a d-dimensional Euclidean space, Rd,calledthe feature space.
CONTINUOUS FEATURES LOSS FUNCTION 1 • Let {1, 2,…, c} be the set of “c” categories • Let {1, 2,…, a} be the set of “a”possible actions • Let (i|j) be the loss incurred for taking action i when the state of nature is j
Ex 1: Fish classification X= is the image of fish x =(brightness, length, fin #, etc.) is our belief what the fish type is = {“sea bass”, “salmon”, “trout”, etc} is a decision for the fish type, in this case = {“sea bass”, “salmon”, “trout”, “manual expection needed”, etc} Ex 2: Medical diagnosis X= all the available medical tests, imaging scans that a doctor can order for a patient x =(blood pressure, glucose level, cough, x-ray, etc.) is an illness type ={“Flu”, “cold”, “TB”, “pneumonia”, “lung cancer”, etc} is a decision for treatment, = {“Tylenol”, “Hospitalize”, “more tests needed”, etc} Examples
CONTINUOUS FEATURES LOSS FUNCTION • (i|j) be the loss incurred for taking action i when the state of nature is j • The posterior, P(j|x), can be computed from Bayes formula: where the evidence is: • The expected loss from taking action i is:
CONTINUOUS FEATURES BAYES RISK • An expected loss is called a risk. • R(i|x) is called the conditional risk. • A general decision rule is a function (x) that tells us which action to take for every possible observation. • The overall risk is given by: • If we choose (x) so that R(i(x)) is as small as possible for every x, the overall risk will be minimized. • Compute the conditional risk for every and select the action that minimizes R(i|x). This is denoted R*, and is referred to as the Bayes risk. • The Bayes risk is the best performance that can be achieved.
CONTINUOUS FEATURES TWO-CATEGORY CLASSIFICATION • Let 1 correspond to 1, 2 to 2, and ij = (i|j) • The conditional risk is given by: R(1|x) = 11P(1|x) + 12P(2|x) R(2|x) = 21P(1|x) + 22P(2|x) • Our decision rule is: choose 1 if: R(1|x) < R(2|x); otherwise decide 2 • This results in the equivalent rule: choose 1 if: (21- 11) P(x|1) > (12- 22) P(x|2); otherwise decide2 • If the loss incurred for making an error is greater than that incurred for being correct, the factors (21- 11) and(12- 22) are positive, and the ratio of these factors simply scales the posteriors.
CONTINUOUS FEATURES LIKELIHOOD • By employing Bayes formula, we can replace the posteriors by the prior probabilities and conditional densities: choose 1 if: (21- 11) p(x|1) P(1) > (12- 22) p(x|2) P(2); otherwise decide2 • If 21- 11 is positive, our rule becomes: • If the loss factors are identical, and the prior probabilities are equal, this reduces to a standard likelihood ratio:
Minimum Error Rate MINIMUM ERROR RATE • Consider a symmetrical or zero-one loss function: • The conditional risk is: The conditional risk is the average probability of error. • To minimize error, maximize P(i|x) — also known as maximum a posteriori decoding (MAP).
Minimum Error Rate LIKELIHOOD RATIO • Minimum error rate classification: choose i if: P(i|x) > P(j|x) for all ji
3. It is known that 1% of population suffers from a particular disease. A blood test has a 97% chance to identify the disease for a diseased individual, by also has a 6% chance of falsely indicating that a healthy person has a disease. a. What is the probability that a random person has a positive blood test. b. If a blood test is positive, what’s the probability that the person has the disease? c. If a blood test is negative, what’s the probability that the person does not have the disease? Example
S is a boolean RV indicating whether a person has a disease. P(S) = 0.01; P(S’) = 0.99. • T is a boolean RV indicating the test result ( T = true indicates that test is positive.) • P(T|S) = 0.97; P(T’|S) = 0.03; • P(T|A’) = 0.06; P(T’|S’) = 0.94; • (a) P(T) = P(S) P(T|S) + P(S’)P(T|S’) = 0.01*0.97 +0.99 * 0.06 = 0.0691 • (b) P(S|T)=P(T|S)*P(S)/P(T) = 0.97* 0.01/0.0691 = 0.1403 • (c) P(S’|T’) = P(T’|S’)P(S’)/P(T’)= P(T’|S’)P(S’)/(1-P(T))= 0.94*0.99/(1-.0691)=0.9997
A physician can do two possible actions after seeing patient’s test results: • A1 - Decide the patient is sick • A2 - Decide the patient is healthy • The costs of those actions are: • If the patient is healthy, but the doctor decides he/she is sick - $20,000. • If the patient is sick, but the doctor decides he/she is healthy - $100.000 • When the test is positive: • R(A1|T) = R(A1|S)P(S|T) + R(A1|S’) P(S’|T) = R(A1|S’) *P(S’|T) = 20.000* P(S’|T) = 20.000*0.8597 = $17194.00 • R(A2|T) = R(A2|S)P(S|T) + R(A2|S’) P(S’|T) = R(A2|S)P(S|T) = 100000* 0.1403 = $14030.00
A physician can do three possible actions after seeing patient’s test results: • Decide the patient is sick • Decide the patient is healthy • Send the patient for another test • The costs of those actions are: • If the patient is healthy, but the doctor decides he/she is sick - $20,000. • If the patient is sick, but the doctor decides he/she is healthy - $100.000 • Sending the patient for another test costs $15,000
When the test is positive: • R(A1|T) = R(A1|S)P(S|T) + R(A1|S’) P(S’|T) = R(A1|S’) *P(S’|T) = 20.000* P(S’|T) = 20.000*0.8597 = $17194.00 • R(A2|T) = R(A2|S)P(S|T) + R(A2|S’) P(S’|T) = R(A2|S)P(S|T) = 100000* 0.1403 = $14030.00 • R(A3|T) = $15000.00 • When the test is negative: • R(A1|T’) = R(A1|S)P(S|T’) + R(A1|S’) P(S’|T’) = R(A1|S’) P(S’|T’) = 20,000* 0.9997 = $19994.00 • R(A2|T’) = R(A2|S)P(S|T’) + R(A2|S’) P(S’|T’) = R(A1|S) P(S|T’)= 100,000*0.0003 = $30.00 • R(A3|T’) = 15000.00
Example For sea bass population, the lightness x is a normal random variable distributes according to N(4,1); for salmon population x is distributed according to N(10,1); Select the optimal decision where: • The two fish are equiprobable • P(sea bass) = 2X P(salmon) • The cost of classifying a fish as a salmon when it truly is seabass is 2$, and t The cost of classifying a fish as a seabass when it is truly a salmon is 1$. 2
Exercise Consider a 2-class problem with P(C1) = 2/3, P(C2)=1/3; a scalar feature x and three possible actions a1, a2, a3 defined as: a1: choose C1 a2: choose C2 a3: do not classify Let the loss matrix (ai | Cj) be: • And let P(x | C1) = (2-x)/2, P(x | C2) =1/2, 0 x 2 • Questions: • Which action to decide for a pattern x; 0 x 2 • What is the proportion of patterns for which action a3 is performed (i.e., “do not classify”) • Compute the total minimum risk • If you decide to take action a1 for all x, then how much the total risk will be reduced.
Solution: P(x) = (5-2x)/6 P(C1 | x) = (4-2x)/(5-2x); 0 x 2 P(C2 | x) = 1/ (5-2x) This leads to conditional risks: r1(x) = r(a1 | x) = 0.P(C1 | x) + 1. P(C2 | x) = 1/(5-2x) r2(x) = r(a2 | x) = 1.P(C1 | x) + 0. P(C2 | x) = (4-2x)/(5-2x) r3(x) = r(a3 | x) = 1/4.P(C1 | x) + 1/4. P(C2 | x) = 1/4 Bayes decision rule assigns to each x the action with the minimum conditional risk. The conditional risks are sketched in the following figure and the optimal decision rule is therefore:
r1 r2 r3 0.5 11/6 2 x If 0 x 0.5 then “action a1” = “choose C1” If 0.5 x 11/6 then “action a3” = “do not classify” If 11/6 x 2 then “action a2” = “choose C2”
In this particular case the action “do not classify” is optimal whenIever x is between ½ and 11/6 2) Therefore, “do not classify” action has been performed for 60% of the input patterns. 3)Total minimum risk 4) If instead of using Bayes classifier we choose to take a1 for all x, then the total risk is:
GAUSSIAN CLASSIFIERS Case 1: i = 2I Features are statistically independent, and all features have the same variance: Distributions are spherical in d dimensions. 6
GAUSSIAN CLASSIFIERS THRESHOLD DECODING • This has a simple geometric interpretation: • The decision region when the priors are equal and the support regions are spherical is simply halfway between the means (Euclidean distance).
GAUSSIAN CLASSIFIERS Note how priors shift the boundary away from the more likely mean !!! 6
3-D case GAUSSIAN CLASSIFIERS 6