Download
1 / 39
390 likes | 459 Views
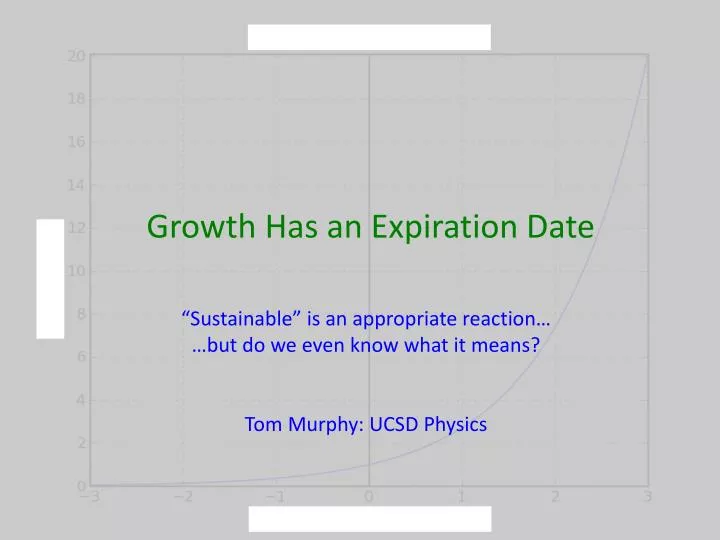
Growth Has an Expiration Date. “Sustainable” is an appropriate reaction… …but do we even know what it means? Tom Murphy: UCSD Physics. Shall We Continue Growth?. We associate growth with progress cars, TVs, air travel, iGadgets ,… quality of life improves investment pays interest

E N D
Growth Has an Expiration Date “Sustainable” is an appropriate reaction… …but do we even know what it means? Tom Murphy: UCSD Physics
Shall We Continue Growth? • We associate growth with progress • cars, TVs, air travel, iGadgets,… • quality of life improves • investment pays interest • Initially restrict attention to physical growth (energy) • Surplus energy (beyond the bare amount needed for survival) has translated into: • more food available, more people, more industry, economic growth • Our energy use, now at 12 TW globally, has historically grown at >2% per year • What will this mean if we continue expanding energy use at this rate?
U.S. Energy Historical Growth: 2.9% logarithmic plot of the same 1650 2050 2050 1650 Sum of all forms of energy used in the U.S. (fossil fuels, nuclear, hydro, wood, etc.) Red curve is exponential at 2.9% per year growth rate
The Road We’re NOT On power output of the entire Milky Way galaxy power output of sun 2500 years 1400 years solar power reaching Earth’s upper atmosphere all solar solar power reaching Earth’s land land 421 yr 336 yr 12 TW today (1.2×10¹³)
Waste Heat Boils Planet (not Global Warming) sun surface temperature thermodynamic consequence of arbitrary energy technology on Earth steel melts 450°F paper burns 212°F water boils body temperature 99°F global warming? 75°F 59°F
Reality Check • This calculation shows how ridiculous, absurd, fantastical any notion of exponential growth becomes • Many reasons prevent us from continuing growth trajectory • obviously, we won’t cook ourselves • continued growth presupposes population growth • we certainly can’t get far along the curve using finite fossil fuels • The lesson: our future must abandon growth, at some point • yet most economists and planning commissions assume growth
Does the Logistic Shoe Fit? • We fit an exponential to our energy history, but recent decades have seen an underperformance • Is this better fit by a logistic function? • Three limiting cases to explore: • indefinite exponential growth • logistic leveling to constant rate of energy use (renewables) • logistic description of finite resource (power down)
Three Cases Fit to U.S. Energy History exp: 3.0% growth level off: 1973 inflection: 40% more to go power down: 2009 peak
On a Linear Scale exp: 1.8% growth; poor fit to data dotted is 3% fit from semi-log graph level off: inflection 1971 33% more to go power down: peak 2013 The data are not presently able to predict which curve we’re on: both logistics fit well
The Allure of the Growth Narrative • Our narrative is one of growth • It’s what our parents, grandparents, great grandparents, etc. have known: we are reluctant to give it up • We tend to think that even if population levels off, that if energy availability levels off (or even goes down), we can still manage economic growth by: • bringing up standards of living (even without extra energy) • efficiency gains (do more with less) • technology innovations (new gadgets keep economy humming) • But such things cannot become the wholeeconomy • at the end of the day, we’re tied to the physical/energy streams provided by the natural environment • divorcing our economy from physical limits is pure fantasy
Snapshot of Current Growth 5% growth 2.9% growth Before 1950, growth tracked 2.9% energy rate well; souped-up since then
What’s in the Gap? • That the economic scale outpaces the energy scale over the past half-century is a triumph • does it portend the future? • especially in the context of declining fossil fuel availability? • The gap is in part due to increased energy efficiency • doing more with less (details on next slide) • The other part is growth in the “service” sector • loose term encompassing innovation, office work, selling each other houses, iGadget consumer wave, psychotherapy, economics, etc. • low-energy activities clearly exist, and can increase for a time
How much can efficiency improve? • The shining examples are refrigerators and cars • doubling efficiency in 35 years means 2% per year improvement • But not all examples are shining • power plants, air travel only 1%/yr improvement over 40 years • And some things don’t change • heating a liter of water 1°C will always take 1 kilocalorie of energy • electric motors (fans, pumps, etc.) are pretty saturated above 80% • moving a family down the road at freeway speeds fights air resistance • Efficiency is a hat with only one or two bunnies in it • thermodynamic limits, 100% cap means only factor of two across the board is realistic • Adopt model where 1% can continue until another factor of two is achieved across the board (on average)
Air Travel Efficiency Gains (Jets) 1%/yr prop planes Despite aggressive campaign to improve efficiency, 1% per year is typical
Leveling Energy/Efficiency Service Ho! If energy levels out, and efficiency saturates, “service” levels would become silly by mid-century to keep the 5% growth train rolling
Yup, There is an End to Growth! • Physical growth is undoubtedly bounded • independent of energy technology: thermodynamic conclusion • There areviable mechanisms for economic growth requiring little or no physical growth • examples abound (and bubble and burst sometimes) • But their reach is limited; can’t skip off into la-la land forever • existence of examples does not mean that 99.99999% of our economy could be driven by non-energy activities (making limited energy ~free!) • meanwhile, everythingtakes some energy: physical limits don’t disappear • Therefore: Economic Growth Must End • failure to adopt steady-state economy results in overshoot/collapse
Stop Growth, or Suffer Overshoot • If we do not deliberately stop the growth goal, the dynamic system is fated to overshoot • Negative feedback mechanisms are unavoidably delayed compared to the here-and-now positive feedback of growth • population, pollution, depletion, etc. created now; consequences later • A universal consequence is overshoot, followed by crash • Driving blindfolded, receiving directions from a passenger introduces delay to corrective (negative feedback) measures • the only safe state is slow and steady(no acceleration, please!) • Yes, our smarts can save us, but only if applied to the fundamental problem: STOP THE GROWTH TRAIN! • desperately need transition to steady-state economy
A Look at Population Semi-log plot straight line in this plot is exponential behavior slope indicates growth rate 1%/yr (70 yr) 0.035% per year (2000 yr doubling) (10,000 B.C.)
Surplus Energy Grows Babies 1.9%/yr (36 yr) Green (oil) Revolution 0.8%/yr industrial (coal) revolution 0.4%/yr 0.09%/yr 1865 1950
Perspective on Our Joy Ride • This cartoon is from an energy/environment textbook, pointing out how special this moment in history really is • We found the Earth’s battery, expending it as fast as we can • Treating the last 200 years as “normal” is perilous
What Happens Next? • The future beyond our fossil fuel surge is not written • A return to more primitive ways is a distinct possibility • most say 2200 will be as unimaginable to us as 2000 would be in 1800 • I agree: who could have imagined we’d be clubbing each other over the heads with half-gnawed bones 200 years after the height of the fossil fuel age?! • let’s have some humility, and not be unjustifiably asymmetric (6000 B.C.)
Sustainable Option 1: Level Out Here • Leveling out at today’s scale means roughly 1/5 U.S. standard • because U.S. is 5% of population, 25% of energy • inequalities are difficult to justify in no-growth world • Could we even sustain today’s physical throughput? • pollution, fisheries, rain forests, soil quality, aquifers, minerals, etc.
Sustainable Option 2: Everyone Lives Large • If we wanted the world to live like Americans, we need 10× • 5× for today’s population at today’s standards, 10× for a bit of growth in both aspects • Pull back to 5× to allow efficiency, etc. • Makes the amazing fossil fuel ride look like a blip • What makes us think we can do this?
Stepping Up • A kid might really want a pet pony • A smart parent might approach the problem step-wise 1× 2× 5× 3× 4×
We’re Not Taking Care of Our Gerbil • We’re having tremendous difficulty managing the 1× case • we have not demonstrated that we can take care of our gerbil • pollution, CO2, fisheries, rain forests, soil erosion, aquifer depletion, etc. • What makes us think we deserve a pony? • are we deluding ourselves about our capacity to manage? • Do we then deserve to be brandishing the word “sustainable?” • we have no clear idea what it means, or at what level we can expect to operate • This fossil fuel joy ride has clouded our judgment • we tend to attribute our progress to our smarts, not to surplus energy
The Energy Trap • Once we begin a fossil fuel decline, we hit a trap • a new energy infrastructure requires up-front energy investment… • …exactly the thing that is in short supply • we must intentionally make decline worse; politically untenable • 10:1 EROEI and 40 year lifetime 1 unit of energy/year costs 4 up front • nature provides no energy financing: can’t build windmill on promised energy • instant relief by abandoning crash program is too tempting
Summary • Physical growth will end on Earth, independent of technology • Economic growth cannot continue for long without energy growth • we should begin taking steady-state economics seriously • We have no idea what a sustainable existence really means • and our gerbil performance has not deserved us the pony we want • The Energy Trapbuilds in severe FF withdrawal symptoms • largely unappreciated, politically ruinous • Let’s not be glib. We’re not as clever as we look in the mirror.
Learn more at my new blog: Do the Math >400,000 pageviews since July 2011 start physics.ucsd.edu/do-the-math/ or Google: do the math also check out: Ecological Economics (textbook by Daly and Farley)
Finite resource, no overshoot Logistic inflection point (halfway) Starts off like exponential, but inflects and then levels off. Still growing at halfway (inflection) point, but linearly, before rolling over
Rate of expansion/production The slope of the logistic curve follows a bell-shape. Initially looks like an exponential. But not exactly the Gaussian (usual) bell-shape.
Growth rate declines with time For logistic curve, the fractional growth (amount produced relative to total) declines, whereas the same measure for exponentials is constant (flat). At the midpoint, the fractional growth is down to half (even while rate is maximum)
A different view of growth rate Plotting against cumulative amountrather than time, the decline is linear. Individual points are equally spaced in time: dwell on ends; fly through middle part. Can be used to anticipate ultimate production, before the end