Download
1 / 74
740 likes | 866 Views
2007 Office of the CIO Technology Poll Results. Information Technology Questions Office of the Chief Information Officer. 2007 Technology Poll Background. Conducted between January and February 2007

E N D
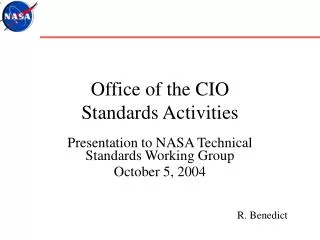
2007 Office of the CIOTechnology Poll Results Information Technology Questions Office of the Chief Information Officer
2007 Technology Poll Background • Conducted between January and February 2007 • Survey contained information technology (IT) questions from the Chief Information Officer (CIO), including the Office of Information Technology (OIT), Technology Enhanced Learning and Research (TELR), OSU Libraries and the Ohio Learning Network • Faculty and Staff – first contact by campus mail; then sent an e-mail direct them to to online survey • Students sent e-mail directing them to web survey
2007 Technology Poll Background 1817 respondents in total
Communications from the CIO Keep Faculty Informed about Events/Services
Communications from the CIO Keep Staff Informed about Events/Services
Communications from the CIO Keep Grad/Professional Students Informed about Events/Services
Communications from the CIO Keep Undergraduate Students Informed about Events/Services
Satisfaction with helpfulness and responsiveness of other IT support resources at Ohio State in 2007
Satisfaction with the Ohio State central e-mail service in 2007
Overall level of satisfaction with IT services at Ohio State in 2007
Familiarity with IT resources • Very familiar or familiar with IT resources • 34% Undergraduate students • 33% Graduate/Professional students • 25% Staff • 24% Faculty
Home Computers • 2007data • 98% Faculty • 99% G/P • 99% U • 94% Staff
Laptop as primary computer among respondents having home computers 2007 data • 46% Faculty • 62% G/P • 62% U • 32% Staff
Windows PC vs. Mac as primary platform • 2007 Mac data • 20% Faculty • 13% G/P • 10% U • 5% Staff
Use of wireless connection for secondary computer • Over 66% of all groups reported wireless connections for secondary computers in the 2007poll
Absence of home ISP to connect to university network 2007 data • 6% Faculty • 6% G/P • 3% U • 14% Staff
Undergraduate students with ISP before OSU and retention • In 2007, of the 83% who had an ISP before coming to Ohio State, 46% retained the ISP
Graduate/Professional students with ISP before OSU and retention • In 2007, of the 74% who had an ISP before coming to Ohio State, 42% retained the ISP
Use of home ISP for more than 20 hours per week 2007 Data • 42% U • 40% G/P • 34% faculty • 18% Staff
Use of computer labs by undergraduate students 2007 data 74% <10 hours 19% 10-20 hours 6% 21-60 hours <1% >60 hours
Use of computer labs by graduate/professional students 2007 data 74% <10 hours 14% 10-20 hours 9% 21-60 hours 2% >60 hours
Aware of OSU/OIT System Status Page (monitoring E-mail, Carmen etc.)
Experienced a virus on any computer 2007 data • 15% Faculty • 29% G/P • 34% U • 22% Staff
Virus on personal vs. Ohio State computers 2007 data • Student data shows that computer labs tend to almost free of viruses • Faculty (3%) almost no viruses on Ohio State computers • Staff reported slightly more viruses (6%)
Use of personal firewalls 2007 data • 64% Faculty • 68% G/P • 72% U • 62% Staff
Use of PDA’s Overall use of PDA’s 29% in 2005 25% in 2006 23% in 2007
Use of PDA’s with wireless Overall Use of PDA’s with wireless 24% in 2004 29% in 2005 32% in 2006 49% in 2007
Current IT environment supports faculty teaching/instruction
Current IT environment supports graduate/professional students in teaching/instruction
Ability to access Ohio State computing and electronic information from office/lab
Ability to access Ohio State computing and electronic information from home