DeCoM Validation
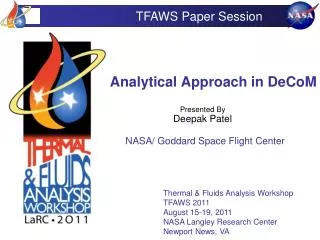
TFAWS Paper Session. DeCoM Validation. Presented By Deepak Patel NASA/ Goddard Space Flight Center. Thermal & Fluids Analysis Workshop TFAWS 2011 August 15-19, 2011 NASA Langley Research Center Newport News, VA. Acknowledgments . Hume Peabody Matthew Garrison Dr . Jentung Ku

DeCoM Validation
E N D
Presentation Transcript
TFAWS Paper Session DeCoM Validation Presented ByDeepak Patel NASA/ Goddard Space Flight Center Thermal & Fluids Analysis WorkshopTFAWS 2011August 15-19, 2011 NASA Langley Research CenterNewport News, VA
Acknowledgments • Hume Peabody • Matthew Garrison • Dr. Jentung Ku • Tamara O'Connell • Thermal Engineering Branch at Goddard Space Flight Center TFAWS 2011 – August 15-19, 2011
Outline • Introduction • Thermal Analysis Tools • Analysis cases • Developed/Exercised 1D computer codes • DeCoM/EXCEL • TTH • FloCAD • Compare 1D Results • Validate against 2D Test Case • Integrate into ATLAS Instrument Model • Conclusion • Problems Encountered/ Lessons Learned • Summary • Future Work TFAWS 2011 – August 15-19, 2011
Introduction:Thermal Analysis Tools • Thermal Analysis is based on a Nodal Network Scheme • Thermal Desktop (TD): Used for View Factors and Environmental heat calculations. • A GUI (Graphical User Interface) for GMM (Geometric Math Model). • Also generates SINDA (System Improved Numerical Differencing Analyzer) construct logics • FloCAD: GUI for FLUINT (Fluid Integrator) constructs. TFAWS 2011 – August 15-19, 2011
Introduction:Analysis Cases • 1D – Radiator • Similar area to ATLAS radiator model in Thermal Desktop (TD) • 1D – Condenser (1D Flow) • Length: 372in , Diameter: ¼” • Steady state conditions, constant mass flowrate • Ammonia as working fluid • Environment • Radiative Tsink = -80C • Limitations • Single condenser line • No evaporator/CC modeled • Short condenser nodes (2” Nodes) • Analysis Cases & Calculated % Area margin • **Cases developed for test-bed/development purposes – not design ATLAS Radiator: The routing and the radiator are represented, in order to create a simplified 1D model (as shown below) 6 in 372 in Condenser Radiator ATLAS Laser Scenarios
Outline • Introduction • Developed/Exercised 1D computer codes • DeCoM • TTH • FloCAD • Compare 1D Results • Validate against 2D Test Case • Integrate into ATLAS Instrument Model • Conclusion • Problems Encountered/ Lessons Learned • Summary • Future Work TFAWS 2011 – August 15-19, 2011
EXCEL/DeCoM Implementation • EXCEL implementation • Calculate LHP condenser performance off-line using boundary conditions similar to those from the 1D analysis cases. • Project GLAS (GeoScience Laser Altimeter System) had predicted its condenser results based on EXCEL analysis similar to the one in this implementation. • Tested for steady state results only. • For multiple iterations, manual input is required. • DeCoM (Deepak Condenser Model) implementation • Code based on FORTRAN language. • Model works for transient and steady state conditions • Steady state results are produced, to compare against 1D EXCEL model. • Calculate condenser fluid quality, temperature values, and fluid – wall convection value. • Radiator and wall temperatures are calculated by SINDA. • Input DeCoM in VAR 1 of SINDA, in order for the logic to be executed at every time step. • **Equations based on Governing Theory from previous slides. TFAWS 2011 – August 15-19, 2011
EXCEL/DeCoM Implementation:Nodal Network These temperatures and conductor values are calculated by EXCEL/DeCoM Fluid Boundary Nodes Fluid – Wall Conductor Wall Nodes Wall – Rad Conductor Radiator Nodes Nodal Network • DeCoM/EXCEL Internal • The above diagram shows the network of nodes in the solution (code). TFAWS 2011 – August 15-19, 2011
EXCEL/DeCoM Implementation: Calculations Flow Chart Initial Conditions i= 1 , N Read Input Values YES NO Determine Fluid Stage 2-Phase Fluid Subcooled Liquid Calculate Fluid to Wall Heat Transfer Value Solve for, φi (as shown in Equation Slides) Calculate Fluid Parameters Output Fluid Parameters TFAWS 2011 – August 15-19, 2011
TTH (Triem T. Hoang) Implementation • TTH Description • NASA SBIR (Small Business Innovation Research) task development software • A LHP system solver (CC, Evap, Cond, L/V Lines). • Compiled library for use in SINDA. • Appropriate for transient and steady state cases • TTH condenser is part of an overall LHP model code. • Condenser section of the code was called as a subroutine for specific computations. Independently of other components. • Implementation • Used as a validation tool against EXCEL/DeCoM implementation. • Output steady state results only. • Restricted to steady state in order to compare with EXCEL implementation. • Calculates fluid temperatures, quality and heat transfer value between fluid and wall. SINDA calculates radiator temperatures. TFAWS 2011 – August 15-19, 2011
FloCAD Implementation • FloCAD • FloCAD with FLUINT calculates entire network with fluid nodes, wall nodes, and radiator nodes as one network. • DeCoM calculates fluid node parameters based on wall node conditions (which are based on radiator nodes) • Third data point for comparison to TTH & EXCEL/DeCoM Implementations for 1D. • Implementation • Initial and boundary conditions similar to DeCoM/EXCEL and TTH. • Lockhart-Martinelli correlation option used Plenum Thermal Desktop – FloCAD network MFRSET STUBE Fluid node Junction TIE Wall node Conductor Radiator node TFAWS 2011 – August 15-19, 2011
Outline • Introduction • Develop/Exercise 1D Computer Codes • DeCoM • TTH • FloCAD • Compare 1D Results • Validate against 2D Test Case • Integrate into ATLAS Instrument Model • Conclusion • Problems Encountered/ Lessons Learned • Summary • Future Work TFAWS 2011 – August 15-19, 2011
Results and Comparison – 1D: Analysis Case • Tsat = -4 C Power = 216 W • Tsat = 16C Power = 216 W • Tsat = 23C Power = 142 W ATLAS Radiator: The routing and the radiator is represented, in order to create a simplified 1D model (as shown adjacently) (ATLAS radiator was unfolded with the condenser to create a 1D model ) ATLAS Radiator 1D Condenser Radiator TFAWS 2011 – August 15-19, 2011
Results and Comparison – 1D:Quality Vs. Temperature (Tsat = -4 C) TFAWS 2011 – August 15-19, 2011
Results and Comparison – 1D:Quality Vs. Temperature (Tsat = 16 C) DeCoM 16 TL DeCoM 16 XL TFAWS 2011 – August 15-19, 2011
Results and Comparison – 1D: Quality Vs. Temperature (Tsat = 23 C) FloCAD/DeCoM/EXCEL have similar results TFAWS 2011 – August 15-19, 2011
Results and Comparison – 1D: TTH Justification PIPE2P routine G values printed out from TTH LHP Condenser functions. h (W/m2K) HX1LEG() x, quality Log Scale of G value comparison between DeCoM and TTH x, quality PIPE2P routine h (W/m2K) -> G (W/K) SINDA TFAWS 2011 – August 15-19, 2011
Results and Comparison – 1D: Summary • The hand calculated length is an estimate at which all input power would be rejected. • DeCoM/EXCEL and FloCAD results are close to hand calcs in comparison to TTH condenser method. • Results show that TTH condenses much earlier than other methods. • TTH code calculates the quality based on a G value from empirical data (6000 W/m2K, for Vapor). • DeCoM and FloCAD calculate the quality based on a G value from the Lockhart-Martinelli correlation. • FloCAD seems to use more CPU time. • DTIMEF chosen by SINDA • User must be familiar with run settings, in order to decrease the CPU time. Once the modifications were made, CPU time was ~8.0 seconds. • DeCoM method is both accurate and fast. TFAWS 2011 – August 15-19, 2011
Outline • Introduction • Developed/Exercised 1D computer codes • DeCoM • TTH • FloCAD • Compare 1D Results • Validate against 2D Test Case • Integrate into ATLAS Instrument Model • Conclusion • Problems Encountered/ Lessons Learned • Summary • Future Work TFAWS 2011 – August 15-19, 2011
Model Correlation – 2D: GLAS LHP Test Case & Setup 31” • GLAS DM LHP Test Case OD=0.127” Fluid = Propylene Wall to Radiator I/F: Width = ¾”, NuSil 48” • 1/8” Al radiator • 3 mil Kapton on front and blankets on back. Liquid Line • Temperature sensor location (data point from which TLL was measured.) NOTE: Test values, and its results have been extracted from the document: GLAS Final Test Report of DM LHP TV Testing TFAWS 2011 – August 15-19, 2011 Thermal Desktop Model GLAS DM LHP
Model Correlation – 2D: Results ΔTavg = ~2.6C • DeCoM implementation • Approximate length of the condenser was used, based on scaling, as shown in previous slide. • Liquid line was also approximated to be starting from the TLL sensor Location. • Only the condenser outlet temperature was compared, due to the lack of temp. sensor data. • Test data vs. DeCoM : steady state results • mFLOW*Cp*ΔTavg equates to ~1.9W, which may be the result of parasitic heat leak from the system. (1.9W is the amount of subcooling greater then the test data) • Modified power shows the temperature differences are less then a 1⁰C. • Possible factors for this heat leak, resulting in power/temperature differences • Mechanical support structure. • Transport lines insulation (modeled assumed to be perfectly insulated) Twall = -86.84 C w/ 0.125” thickness TFAWS 2011 – August 15-19, 2011
Outline • Introduction • Developed/Exercised 1D computer codes • DeCoM • TTH • FloCAD • Compare 1D Results • Validate against 2D Test Case • Integrate into ATLAS Instrument Model • Conclusion • Problems Encountered/ Lessons Learned • Summary • Future Work TFAWS 2011 – August 15-19, 2011
Integrate into ATLAS Instrument Model: Method Selection • Requirements for ATLAS model integration • Source code available for distribution and/or modification • Must not be detrimental to model runtime. • Method validated against test data and hand calculations. • Selected method • TTH is not easily distributable or modifiable. Based on the work performed (explicitly for condenser, and 1D model) further validation of the condenser subroutine is required. • FloCAD take longer to calculate. • If model is not well configured, it may take longer, else the difference is shown in previous 1D analysis slide. • One of the drawbacks, is that it requires a license • DeCoM is distributable, accurate and fast. Therefore, DeCoM was chosen to be used as the code to predict the ATLAS laser radiator performance. TFAWS 2011 – August 15-19, 2011
Integrate into ATLAS Instrument Model: Method Integration 68.7” ** Condenser routing is preliminary 2” x 2” Nodes Al HC Panel 39.3” Radiator Cond L = 325”, OD = ¼ “ NuSil I/F between pipe and radiator. Inlet Condenser line Outlet • ATLAS radiator thermal design • Size the radiator (Lowest TLaser, Highest QLaser, Hot Environment) • Size the radiator heater (Highest/Lowest QLaser , Cold Environments) • Heater is sized to prevent condenser fluid from freezing. TFAWS 2011 – August 15-19, 2011
Integrate into ATLAS Instrument Model: Temperature Maps • Test Case: -4 C / 212 W • Lowest TLaser, highest QLaser Hot Beta 0o • Currently no gradient requirements are set. Temperature maps are produced for STOP analysis purposes. Orbit Day Orbit Shadow Exit • Subcooling cancelation occurs when some amount of heat leaks from the vicinity of 2-phase into subcooling region. • Points on the maps, represent phase change (A,A’) and subcooling cancelation (1A,2A, 1A’) locations. Points are graphically represented in the next slides. A 1A A’ 2A 1A’ Temperature, C
Integrate into ATLAS Instrument Model: Quality vs. Temperature (TSAT = -4.0 C , 212W) A’ A • Radiator experiences both shadow and day environments in HB00 orbit. (below is the graphical representation of HB00 orbit) 1A’ 1A 2A Shadow (OS) Day (OD) Vehicle TFAWS 2011 – August 15-19, 2011
Integrate into ATLAS Instrument Model: Quality vs. Temperature (TSAT = 16.0 C , 212W) B 1B 3B 3B B 1B • Highest QLaser ,CB90 for cold environments. • Subcooling cancelation points occur due to heat leak from the adjoining 2-Phase section of the condenser line. 2B 2B Condenser Length (in) TFAWS 2011 – August 15-19, 2011
Integrate into ATLAS Instrument Model: Quality vs. Temperature (TSAT = 23.0 C , 142W) • Lowest QLaser ,CB90 for cold environments. • 2-phase section for this case is minimal, therefore the subcooling temperature increases significantly (at noted locations) C 2C C 1C 1C 2C TFAWS 2011 – August 15-19, 2011 Condenser Length (in)
Integrate into ATLAS Instrument Model: Radiator Heat Imbalance Solar, Albedo, Planet Shine • ( - ) Heat Leaving Radiator • ( + ) Heat Entering Radiator • ATLAS Radiator Heat Data • Tabular data shows that physics of the radiator is satisfied. All energy is balanced. • 2P power does not match the input power • In a phase change (2P to liquid), some amount of heat from liquid phase (node) is leaked back into the 2P (node), and there is a decrease or increase in 2P power depending on the direction of the leak. TFAWS 2011 – August 15-19, 2011
Integrate into ATLAS Instrument Model: Summary • DeCoM integration into ATLAS • The CPU time difference of before and after the Code integration was negligible, difference is less then 1sec. • Results • Minimum liquid line temperature • Results help size the radiator heater power required in order to keep ammonia from freezing. • The last column in the table indicates an approximate amount of heat rejected to the radiator in the subcooled phase. TFAWS 2011 – August 15-19, 2011
Outline • Introduction • Developed/Exercised 1D computer codes • DeCoM • TTH • FloCAD • Compare 1D Results • Validate against 2D Test Case • Integrate into ATLAS Instrument Model • Conclusion • Problems Encountered/ Lessons Learned • Summary • Future Work TFAWS 2011 – August 15-19, 2011
Problems Encountered / Lessons Learned • DeCoM / EXCEL • Property calculations in EXCEL differed from DeCoM • Property vs. temperature plots had to be generated to obtain equation of the lines. • Radiator temperatures were modeled as wall temperatures. • Had to create iterative equations to calculate radiator temperatures. • Reading Thermal Desktop values • Reading/editing node temperatures, conductor heat rates, and modify the conductance values, was learned. • Printing quality and temperature values • A “WRITE” statement (FORTRAN Language) was implemented. • Temperature and quality results did not match EXCEL • EXCEL property Vs. temperature plot equations were applied to the code. FORTRAN programming language was learned from this exercise. TFAWS 2011 – August 15-19, 2011
Problems Encountered / Lessons Learned • TTH Problems Encountered • Integrating with the Thermal Desktop model • Full understanding of the software’s limitations was required. • A library file was inserted to call condenser subroutine for fluid calculations • FloCAD Problems Encountered • Nodal Network was unclear • An understanding of tanks and plenums was required. • Correlation method similar to that of EXCEL and FORTRAN • Parameter to call the Lockhart-Martinelli method had to be applied • CPU time usage was too high (as shown in the 1D results slide) • User input is required, and must be familiar with run settings in order to decrease the CPU time. TFAWS 2011 – August 15-19, 2011
Summary • Understand and develop a condenser Model set of equations • Compare three possible solution methods for a 1D simplified radiator and condenser (1D flow). • Correlate the DeCoM method against test data from GLAS LHP. • Implement the DeCoM into ATLAS thermal model and provide radiator temperature predictions. TFAWS 2011 – August 15-19, 2011
Future Work • DeCoM Future Possibilities • Package the code as a subroutine. • Including user manual for use on other projects. • Better integration with generic SINDA models. • Return of USER requested internal Parameters. (e.g. quality) • Allow user defined node lengths (currently only 2”) • Investigate DeCoMs response to quick transient changes in environment or due to load • Check validity of FloCAD and TTH against the 2D test case. • Correlation against various other LHP test data, will validate the method even further, making it more reliable. • Properties other then Ammonia needs to be built-into the code. • Alternate correlation schemes to Lockhart-Martinelli • Integrate option for multiple condenser lines TFAWS 2011 – August 15-19, 2011
Condenser effects on the Radiator Enjoy this small clip of DeCoM in its workings. TFAWS 2011 – August 15-19, 2011
BACKUPSymbols & Acronyms Subscripts Superscripts Acronyms SINDA: Systems Improved Numerical Differencing Analyzer) FLUINT: Fluid Integrator) SC: SubCooled LL: Liquid Line LHP: Loop Heat Pipe STOP: Structural-Thermal-Optical Performance TFAWS 2011 – August 15-19, 2011