Download
1 / 54
550 likes | 678 Views
t. b. c. s. u. d. Top Quark Mass Measurements at CDF Run II. Kohei Yorita University of Chicago For the CDF Collaboration SLAC June 7 th 2005. Run I World Average (hep-ex/0404010). +4.3. M top (world) = 178.0 GeV/c 2. 4.3. Run II.

E N D
t b c s u d Top Quark Mass Measurementsat CDF Run II Kohei Yorita University of Chicago For the CDF Collaboration SLAC June 7th 2005
Run I WorldAverage (hep-ex/0404010) +4.3 Mtop(world) = 178.0GeV/c2 4.3 Run II • In the Lepton+Jets channel with 318 pb-1 data,(single meas.) Current CDF Official Value ! (Template Method) +4.1 Mtop(CDF) = 173.5 GeV/c2 4.0 • As a cross check, the same dataset and lepton+jets, • but using Matrix Element Method (DLM) +4.3 Mtop(X-check) = 173.8 GeV/c2 (Very New !) 4.1 Brand New Results from CDF ! Better than Run I world average June 7th , 2005 Kohei Yorita , U of Chicago , SLAC Seminar 2/43
e n b d u μ Outline • The Tevatron & CDF • Top Quark Physics • Why Top Mass ? • Top Quark Production and Decay • Key Points of the Measurements • Top Quark Mass Measurements (L+jets) • - Template Technique : (1D and 2D) • - Dynamical Likelihood Method (DLM) • 7. Summary The World’s Best Measurement Dr. E. Particle Q: How many particles in me?
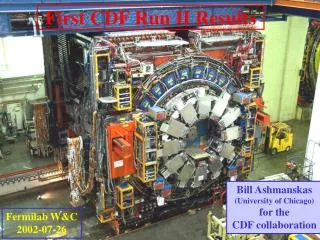
The Tevatron is a proton-antiproton collider with 980 GeV/beam 2 km The TeVatron The World’s only Top Factory ! Record > 1.2 1032 ! Delivered luminosity : > 1fb-1 !!! (Run I : 110 pb-1) June 7th , 2005 Kohei Yorita , U of Chicago , SLAC Seminar 4/43
h = 1.0 h = 2.0 h = 2.8 Collider Detector at Fermilab (CDF) • Run II Upgrades > Tracking System - New silicon tracker b jet tagging !!! - New central drift chamber > New time of flight detector > New Forward Calorimeter - Jet (||<2.0) for top physics > Extended muon coverage > New Electronics, DAQ, Trigger EM : HAD : polar angle June 7th , 2005 Kohei Yorita , U of Chicago , SLAC Seminar 5/43
Silicon Detector Plug Calorimeter COT Muon Chamber Move In to Collision hall ! (Installation…) Some CDF Pictures Assembly hall at CDF June 7th , 2005 Kohei Yorita , U of Chicago , SLAC Seminar 6/43
90% 80% Sep. 2004 shutdown CDF Data Taking • CDF : Data taking efficiency • is stably ~80-90% ! • Now CDF has a total integrated • luminosity of 800 pb-1 on tape!!! • Analyses for today’s talk • based on 318 pb-1 • (Physics quality data until Sep. 2004) June 7th , 2005 Kohei Yorita , U of Chicago , SLAC Seminar 7/43
~100% 15% 85% Top Quark Production and Decay • Production Cross Section • Tree level Diagram ~30 % increase from Run I qq , gg fractions reversed at LHC • Final states : (depend on W decay) • * Higher statistics than dilepton • * Lower background than All jets • Identify “leptonic W” by selecting • Isolated lepton (Et>20 GeV) • Missing Et > 20 GeV • Dilepton (e,) BR=5% • Lepton (e, ) +jets BR=30% • All jets BR=44% • + X BR=21% Golden Channel June 7th , 2005 Kohei Yorita , U of Chicago , SLAC Seminar 8/43
We have detected Top events!!! Counting Method (lepton+jets) Muon + Met + 4jets (2 bjets) candidate Signal region Control region June 7th , 2005 Kohei Yorita , U of Chicago , SLAC Seminar 9/43
Top Quark Physics • Interesting physics in the top sector • Production Mechanism • Direct contact with Vtb • Decay into W+b before hadronization (=410-25 s) • Unique opportunity to probe • bare quark properties. • (top spin(/correlation)? charge?) • Top quark mass at EWSB scale what does this tell us? • Is top the gateway to new physics? W helicity (V-A?) Top Quark Mass Top Spin polarization Production X section Resonance production Production kinematics Decay modes Branching ratios CKM matrix Rare decays FCNC e.t.c. Non-SM decays June 7th , 2005 Kohei Yorita , U of Chicago , SLAC Seminar 10/43
(3) Top quark is heavy (~ 175 GeV = Mb-quark35) Yukawa coupling ~ 1. * Near the EWSB scale. * If we can measure strength of this coupling (i.e.ttH), a test of the Higgs sector in the SM can be possible. MW ( Mtop2, ln(MH) ) Why is Top Mass Interesting? (1) Fundamental Standard Model parameter. (2) Special Relation to Higgs mass, together with W boson mass. (4) By using the top mass as a constraint, ttbar full event reconstruction can be possible. This is very powerful for a test of SM (spin correlation, W helicitye.t.c), or search for non-SM physics ! (tt resonance e.t.c.) RunII Goal : M~ 2 GeV at CDF ! June 7th , 2005 Kohei Yorita , U of Chicago , SLAC Seminar 11/43
Standard Model Higgs Mass: Most probable: 96 GeV 126 GeV Upper limit(95% CL):219 GeV 280 GeV 73 48 Top Mass Run I Review • Old World Average (1999) Mt = 174.3 5.1 GeV (3.24.0) (Fermilab-TM-2084) New DØ l+j measurement, (Nature 429, 638-642 (2004)) • New World Average (2004) Mt = 178.0 4.3 GeV(2.73.3) • hep-ex/0404010 June 7th , 2005 Kohei Yorita , U of Chicago , SLAC Seminar 12/43
Reduce Combinatorics (Ambiguity to form top and anti-top) 2 b tag : 2 jet-parton permutations 1 b tag : 6 jet-parton permutations • 0 b tag : 12 ways to assign 4jets to 4 partons 2 due to -pz ambiguity 4/12/24 for 2/1/0 tag Key Points of The Analysis • Backgrounds and Combinations (jet-parton assignments) - b jet tagging is very important. • How ? : SECVTX b-tagging (excellent silicon detector !) B hadrons are long-lived. • Tight Tagger • 40% / jet • 60% / tt event • Mistag : • ~ 0.5% / jet Identify by Vertex of displaced tracks from primary. • Background Reduction • - Background processes are mostly non-heavy flavor (W+jets, QCD) June 7th , 2005 Kohei Yorita , U of Chicago , SLAC Seminar 13/43
Key : Jet Energy Scale ~ Precision on the determination of jet energies is necessary for Mt measurements ~ All Jets are formed by dR=0.4 cone-clustering algorithm. (1) “Relative to Central” Calibrate forward calorimeter to central calorimeter. - uniform response in etacorrection Non-uniform response (2) “Absolute Scale” (to Hadron) Correction for non-linearity and energy loss in un-instrumental region. Diff. resp. of p0/pi+- Non-linearity (3) “Out of Cone” (to Parton) Correction for leakages outside the cone. (4) Other : Very Small Corrections - Multiple Interaction (minbias, func. of Nvertex) - Underlying Event (minbias, nVtx = 0) Shower, frag. June 7th , 2005 Kohei Yorita , U of Chicago , SLAC Seminar 14/43
Jet Energy Uncertainty Jet Energy Systematic Run II 2005 : O(~3%) Run II 2004 : O(~6%) Now, better than Run I ! - Better understanding of Calorimeter tuning. > In the top quark mass measurements, there are lots of constraints available to improve precision. e.g. ) W Mass Constraint Total fractional uncertainty on jet Pt Centralhregion Run II 2005 Run I Run II 2004 June 7th , 2005 Kohei Yorita , U of Chicago , SLAC Seminar 15/43
Top Quark Mass Measurements~ Lepton+jets ~1D Template Method2D Template MethodDynamical Likelihood Method(Matrix Element)
Top mass isfree parameter 1D Template Method (1) For each event, top mass is extracted by minimizing c2defined as, - Jets resolution term - Unclustered Energy term - W mass constraint and Top mass term (2) Additional selection cut on resulting c2(<9) (3) Build templates of Mt with smallest c2 from MC - Signal with different top mass - Each background source (4) Parameterization : Build signal p.d.f. as a function of generated mass. (5) Fit to the data using unbinned likelihood. June 7th , 2005 Kohei Yorita , U of Chicago , SLAC Seminar 17/43
1D Template : Subdivision • Use 4 categories of events with different background content and reconstructed mass shape. • Subdivision improves • statistical uncertainty. • Subdivision does not • improve systematic uncertainty. Template RMS (GeV) June 7th , 2005 Kohei Yorita , U of Chicago , SLAC Seminar 18/43
+2.9 2.8 1D Template : Data Fit Curves: expected signal andbackground from global best fit 16 ev 57 ev 25 ev 40 ev Mtop(1D)= 173.2 (stat.) 3.4 (syst.) GeV/c2 June 7th , 2005 Kohei Yorita , U of Chicago , SLAC Seminar 19/43
1D Template : Systematics This was ~ 6.2 GeV before (2004) CDF Run II Preliminary (318 pb-1) Big Improvement since an year ago ! Our measurement is systematic dominant ! > Statistical : <3.0 GeV > Jet Energy Scale : 3.1 GeV > Syst. Total : 3.4 GeV June 7th , 2005 Kohei Yorita , U of Chicago , SLAC Seminar 20/43
Further Improvements of Jet Energy Scale(JES) Uncertainty 2D Template Technique M top + JES Simultaneous Fitusing top mass and W mass templates P1(mrecotop;mtop,JES) and P2(mrecojj;mtop,JES) Datasets and event selection are exactly the same as 1D template. CDF’s improved Jet Energy Scale uncertainty almost half since an year ago. 1D Template : ~ 4.4 GeV total uncertainty World’s Best Measurement !
2D Template Why ? and What? • Strong Motivation again.. : • - Current world average • uncertainty (±4.3GeV/c2): • 2.6 GeV/c2 from JES • 2.7 GeV/c2 from stat. • Jets are very hard to calibrate because • there is no nice resonance.. • Obviously, in the future, even now, • this will give a limitation of precision! Fractional error on jet Pt Centralhregion Run II 2005 Run II 2004 Run I • Solution : Use W jj Mass ! 1. Identify jets coming from W 2. Reconstruct their invariant mass mjj 3. mjj strongly dependent on JES 4. MW uncertainty is completely negligible (< 34 MeV) 5. mjj mostly independent of Mtop e n jet jet mjj(W) JES from Wjj is mostly statistical Scale with Luminosity !!!!! June 7th , 2005 Kohei Yorita , U of Chicago , SLAC Seminar 22/43
How to make Mjj template ? • Which jets form W? • All Non-btagged jets pairs are taken into account equally. • 1/3/6 mjj per event with 2/1/0 b-tag • Measuring JES • Make Mjj templates by varying JES • 1 defined by CDF jet group • Fit data with Wjj to measure JES! June 7th , 2005 Kohei Yorita , U of Chicago , SLAC Seminar 23/43
JES vs Mtop vs Mjj Correlations PDFs ( Mjj | Mtop, JES=0):2tag Mtop Mjj Mjj independent of Mtop Mtop strongly depends on JES • So Mtop and JES are simultaneously determined in likelihood fit using shape comparisons of Mt and Mjj template to take into account these correlations. • A Gaussian constraint on JES • from the standard calibration is • included in likelihood as a priori • (01) June 7th , 2005 Kohei Yorita , U of Chicago , SLAC Seminar 24/43
How about b jets? • Mtop measurement is sensitive to energy scale of b jets. • (W mass is constrained.) • - But studies show most uncertainty is shared by light quark and b jets. • - Only 0.6 GeV/c2 additional • uncertainty on Mtop due to • b-jet-specific systematics. Most b-jets energy scale can be set using W→jj June 7th , 2005 Kohei Yorita , U of Chicago , SLAC Seminar 25/43
Top Mass Result with 318 pb-1 Mtop(2D)= 173.5(stat)2.5(JES) 1.7(syst.)GeV/c2 +2.7 2.6 c.f. 1D JES : 3.1 GeV 16 ev 57 ev Black curve from global best fit. 25 ev 40 ev June 7th , 2005 Kohei Yorita , U of Chicago , SLAC Seminar 26/43
JES Results with 318 pb-1 Reconstructed dijet (W) mass: • Agreement data-MC JES is • quite good. • Combined W jj and prior • JES yield 20% improvement Black curve from global best fit. June 7th , 2005 Kohei Yorita , U of Chicago , SLAC Seminar 27/43
Statistical uncertainty • We are a bit on the lucky side, but reasonable. (~9.2%) June 7th , 2005 Kohei Yorita , U of Chicago , SLAC Seminar 28/43
Higgs Mass (SM global fit)using only 2D Template Results +4.1 Mtop(CDF)= 173.5GeV/c2 4.0 Only based on this measurement, SM global fit returned, 150 (upper limit (95%CL) 208 GeV/c2) C.f) Run I world average constraint: Very preliminary Projection and Fit result. June 7th , 2005 Kohei Yorita , U of Chicago , SLAC Seminar 29/43
The Future Projections • Traditional calibrations of JES based on dijet and/or gamma-jet balance are expected to be limited in the future. • Using W jj : JES uncertainty scales with statistics. So we can reach JES uncert. below 1 GeV/c2 in Run II • Reaching a total top mass uncertainty of 2 GeV/c2 can be possible in Run II Now ! June 7th , 2005 Kohei Yorita , U of Chicago , SLAC Seminar 30/43
Other Technique? • Brief summary so far…… • > Results from 1D and 2D template are presented. > Another category : - 1D template (Secvtx + Jet Probability Algorithm for b tagging) 2.9 2.8 Mtop = 173.0 ± (stat.) ± 3.3 (syst.)GeV/c2 = 173.0 + 4.4 – 4.3 GeV • All lepton+jets results are obtained from template technique. • and consistent each other. (173.5(2D), 173.2(1D), 173.0(1D+JP)) • What else ? Matrix Element Technique should be a good cross check and even can aim to have the best result. • Dynamical Likelihood Method (DLM) ! June 7th , 2005 Kohei Yorita , U of Chicago , SLAC Seminar 31/43
The year Leon M. Lederman won the Nobel Prize ! For the neutrino beam method and the demonstration of the doublet structure of the leptons though the discovery of the muon neutrino. Event Selection : (Not the same as template !!!) (1) Exactly 4 tight jets : Et > 15 GeV, |eta| < 2.0 do not use 4 more jets and loose 4th jet (Et > 8) (2) At least one SVX b-tagged jet do not use 0 b tag events. (to increase S/B.) Dynamical Likelihood Method Introduction • The Method : - Basic idea is to use matrix elements convoluted likelihood. - Originally proposed in 1988 by K. Kondo.(J.Phys. Soc. 57, 4126) > DLM : 63 events > Template : 138 events June 7th , 2005 Kohei Yorita , U of Chicago , SLAC Seminar 32/43
Likelihood Definition in DLM For i-th event, likelihood is defined as, F : Parton distribution function for (za,zb) and f : Pt of tt system M: Matrix element of tt process, w : Transfer function, x ; partons y ; observables All possible combinatory is taken into account. - 12/4 sum for 1/2 b tag in total. It : Jet-parton, Is : neutrino Pz (Sw=(l+)2) Analysis procedure (1) At first, all events are considered as signal ttbar. (2) “Signal Likelihood” is calculated for each event. (3) Take joint likelihood of all events. (4) Bias correction by using “mapping function”. Mapping function : function of bkg fraction. June 7th , 2005 Kohei Yorita , U of Chicago , SLAC Seminar 33/43
DLM : Demonstration! For ppt user! L 10 events likelihood distributions: L(M) 165 185 Mtop (GeV) June 7th , 2005 Kohei Yorita , U of Chicago , SLAC Seminar 34/43
Using SM-Matrix Element is too much assumption ? • CDF has probed the properties of top quark but • - NO significant discrepancy has been observed. • (Discovery mode Detailed study) • (2) In the Standard Model, no fundamental/direct prediction of Mt. • (3) Too much rely on SM ? • - All Monte Carlo Events are generated based on SM. • (4) Only considering Leading-Order ME. How about NLO? • - At first order, selecting events with exactly 4 jets minimizes it. • Need careful study (related to ISR/FSR, PDF uncertainty) • (5) BIG ADVANTAGE : Using maximal event information. • The most effective term is “propagator” (not too much assumption here!!!) • < Apparently, it is worth pursuing !!!> June 7th , 2005 Kohei Yorita , U of Chicago , SLAC Seminar 35/43
How likelihood dist. looks like? 25 events example for sig and bkg using generator level input Signal example: - log(likelihood) Bkg example: - log(likelihood) Blue : all added up Black : each comb. Blue : all added up Red : right comb. Black : wrong comb. Range[155-195]GeV Likelihood tends to be higher in lower mass region. Peak around 175 GeV June 7th , 2005 Kohei Yorita , U of Chicago , SLAC Seminar 36/43
Background Effect/Correction • Each Background Effect ~ 2 GeV shift at 21 %. • Mapping Function Slope changes stably. * From 1000 pseudo expt. for each point slope Bkg : 21% June 7th , 2005 Kohei Yorita , U of Chicago , SLAC Seminar 37/43
Linearly / Pull check Slope of 1 1.05 bias • No bias for central value. • 5% correction for the statistical uncertainty. - Assumption is only held for tt events. (4p-4j matched.) • - Not held if ISR/FSR gluon enters leading 4jets. • - Not held for dilepton or backgrounds….. June 7th , 2005 Kohei Yorita , U of Chicago , SLAC Seminar 38/43
DLM Results (318 pb-1) Correction at background fraction of 21%. +2.7 Mtop(DLM)= 173.8 (stat.) 3.3 (syst.)GeV/c2 2.5 June 7th , 2005 Kohei Yorita , U of Chicago , SLAC Seminar 39/43
DLM Stat. and Systematics Systematic uncertainty Data/MC comparison of Statistical uncertainty 10% prob. MC < Data June 7th , 2005 Kohei Yorita , U of Chicago , SLAC Seminar 40/43
Data/MC Comparisons • Event-by-event Maximum • Likelihood Mass • Event likelihood For i-th event, Note : Last bin includes over flow. June 7th , 2005 Kohei Yorita , U of Chicago , SLAC Seminar 41/43
Improvement for JES uncertainty ?~ Hadronic W(jj) Mass ~ • Remove W Mass constraint • from likelihood. Instead, top • Mass is constrained. • Then pick up 2 jets W mass • At maximum likelihood point. • We have a confidence to use • W Mass as a constraint ! • (2) In principle, DLM can use this • to reduce jet energy uncertainty • like 2D Template!!! • - Future improvement here!!! June 7th , 2005 Kohei Yorita , U of Chicago , SLAC Seminar 42/43
Summary > Tevatron is performing very well. Delivered luminosity more than1 fb-1 CDF recorded >800 pb-1 data > 2D template (Mt+JES) provided the best measurements in the world. • - Lots of work to reduce systematics, • especially JES!!! > New techniques are developed. DLM and • template results are consistent. > Other technique/channel (dilepton/all jets) • are coming very soon! > Plan to publish these two results by the end • of this summer.(PRDs) > Combination on going.. Will reach goal of measuring mt to ~ 2 GeV in Run II ! Getting Close !!! June 7th , 2005 Kohei Yorita , U of Chicago , SLAC Seminar 43/43
JES : Relative Correction The Central Calorimeters( = 0.2-0.6) are better calibrated/understood. Correction factor is a function of Pt and , extracted from dijet balance. (check -jet balance) • Uncertainty : ~ 1% level • (depends onregion and Pt) • estimated by varying the selection • requiremens and fitting procedure.
JES : Absolute Scale Correction(to hadron level) Correction for non-linearly and un-instrumental region, based on MC by using single particles (pion,protons,neutrons ). We tuned MC much better and map to hadron level from cal. level. • Uncertainty : 2 ~ 3% level (strong dependency onPt) • Single particle E/P, fragmentation. • - Smaller error : MC/data in tower boundaries, cal. calibration with time.
JES : Out of Cone Correction(to parton level) Correction for energy leakage outside the cone.(0.4 for top physics) 0.4 is small compared to typical QCD events since tt events are crowded but Lose >10% energy for jets with Et<20 GeV. • Uncertainty : 2 ~ 8% level (strongly depends onPt) • Difference between data and MC is taken into account. • (We can compare energy sum outside the cone of jets.)
Results on Blind Sample 5 blinds samples generated by CDF Top Mass group 0.3 GeV is stat. only. All is w/I 1 standard deviation. * Some are Pythia, Others are Herwig. (P - H Syst. = - 0.3 GeV) We observed “NO BIAS”.
DLM measurements of nonSM model(tt resonance X(700)) Sample : X(700) to tt (M=175 GeV), top decay follows SM Reconstructed mass from 30 events P.E. is 176.8 0.4GeV. If X(700) is 100% in the sample, we see 2 GeV bias.
Additional Checks on DLM 16 events overlap between this round and before (162 pb-1) -4.1 GeV