Download
1 / 20
200 likes | 322 Views
Genetic Testing of Feral Horses. E. Gus Cothran Dept. Veterinary Integrated Biosciences College of Veterinary Medicine and Biomedical Science Texas A&M University. Testing began in early 1990s. Usually at the request of an individual from a specific HMA or a private individual.

E N D
Genetic Testing of Feral Horses E. Gus Cothran Dept. Veterinary Integrated BiosciencesCollege of Veterinary Medicine and Biomedical Science Texas A&M University
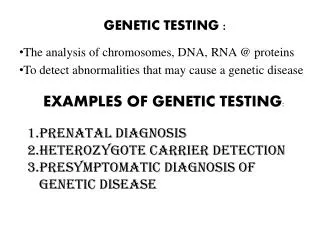
Testing began in early 1990s. • Usually at the request of an individual from a specific HMA or a private individual. • Used blood group and biochemical polymorphisms. • This required taking two blood samples from every horse. • Information supplied by the BLM ranged from none to herd management plans. Usually just a form like the following.
17 loci were routinely tested. • Sample sizes varied but were usually between 25 to 75 animals. • Standard measures of genetic variability were calculated for each herd. • The values were compared to those of domestic horse breeds and to other feral herds.
Genetic similarity and distance measures also are calculated. • These are compared to the major domestic breed groups. • Depending upon the State comparisons to other herds from the area or State may be done. • Dendrograms are given showing similarity to domestic breeds or other feral herds from the state.
Rogers’ genetic similarity of the McCullough Peaks feral horse herd to major groups of domestic horses.
+--MORGAN HORSE +----| | | +----STANDARDBRED PACER | +------| - +--| +------STANDARDBRED TROTTER | | | | +----AMERICAN SADDLEBRED | | +---| | +--| +-------ROCKY MOUNTAIN HORSE | | | +-------TENNESSEE WALKER | +--| +--QUARTER HORSE | | | | | +--| +----HANOVARIAN | | | | | | | | | | +--------TRAKEHNER | | | +--| +--| | | | | | | +-----------HOLSTEIN | | | | | +--| | | | +--| | +-----THOROUGHBRED | +--| | +--| | | | +----WIELKOPOLSKI +--| | | | | | +-------SELLA FRANCAIS | | | | | | +-----KHUZESTAN ARABIAN | | | +--| | | | | | +ARABIAN | | +---| +--| | | | +---------SHAGYA ARABIAN --| | | | | +----------KURD | | | | +---------------AKHAL TEKE | +--| | | +-----------CASPIAN PONY | +--| | +-----TURKOMAN | +---------MCCULLOUGH PEAKS
SIMILARITY .76 .80 .84 .88 .92 .96 1.00 ----+----+----+----+----+----+----+----+----+----+----+---+ +-------------------------- Stewart Creek +-----| | +-------------------------- Eagles Nest +----| | | +----------------------- Cooper Creek +-| +--------| | | +----------------------- Green Mountain +--------| | | | +------------------------------------- White Mountain +--| | | | +--------------------------------------- Happy Creek Springs +-| | | | +------------------------------------------------ 15 Mile Herd +-| | | | +--------------------------------------------------- Cedar Ridge Trap | | +| +----------------------------------------------------- Tilley Creek || || +-------------------------- McCullough Peaks || +-| +|+--------------------------| +-------------------------- Whistle Creek || | || +---------------------------- Dry Creek || |+-------------------------------------------------------- Cold Springs Trap | +--------------------------------------------------------- Muskrat Basin ----+----+----+----+----+----+----+----+----+----+----+---+ .76 .80 .84 .88 .92 .96 1.00
All genetic testing is now done by DNA microsatellite loci. • DNA testing allows the use of pulled mane or tail hairs as samples. • DNA results are analyzed in essentially the same way as blood protein data.
DNA loci give somewhat higher variability measures so are not directly comparable to protein loci. • Rank levels of variation are similar. • Allelic measures of diversity are more important for mSat loci. • Overall DNA gives data that is as useful for population genetic analysis as blood typing.
Over 100 population analyses were made using blood protein loci. • Some herds were tested more than one time. • DNA testing was done on some herds analyzed using blood proteins during transitional period for lab. • Have DNA data for ~180 herds, again, some tested more than once.
Burro testing is very similar to that for horses. The same mSat loci are used although not all work for burros. • Only have four domestic breeds to compare to. • Most burro herds show very low variability.
********************************* Poitou * * *********************** Pannaments CA * **** **** * *********************** Butte Valley CA * * ***** * * * * *********************** Saline Valley CA * * * **** * **** * *************** Slate Range CA * * ********* ********* * *************** Centennial Ca * * * * * ****************************** Clark Mtn. CA * * * * *********** Picacho CA * * **************** * * * *********** Chocolate Mule CA * *********** *** * *********************** Sinbad UT * * **** * * *********************** Yuma 1 AZ * * * * ********************** Minniature * * ******** ***** * ***** ********************** Standard * * * * * * * ************ ***************************** Ossabaw GA * * * * * ********************************* Cibola/Trigo 1 AZ ****************************** * * * * ********************************* Mammoth Jack * * ************** * * ********************************* Sardinian ********** * * * * ***************************** Chemehuevi CA * * ********************** *** * ***************************** Park Moab CA * * * * * ******************************************************************************* Blue Wing NV ** * ** **************************************************************************************** Wikieup AZ ** ************************************************************************************************ Kingman AZ * * * * ********************************************************************************** Seven Tanks NV ** ********** ** ********************************************************************************** East Mohave CA **** * ************************************************************************************************* Ed's Camp Az *** * * * ************************************************************************************************* Yuma 2 AZ * * * *************************************************************************************************** Havasu AZ * ***************************************************************************************************** Cibola/Trigo 2 AZ
Horse Summary • The majority of herds have moderate to high genetic variability. • This is probably due to the mixed origins of the herds. • About 18% of herds have variation levels that are low enough to be of concern. Most of these are just below that level. • Only about 3% have exceptionally low variation.
Variation is usually correlated with population size. • Sometimes variation is high is small populations but this is due to recent reductions. • Most herds have not shown changes in variation levels between two or more sampling periods. This is probably due to not enough time having elapsed for a change to take place. • No large changes in variation level have been seen in any BLM herd to this point.