Download
1 / 25
250 likes | 374 Views
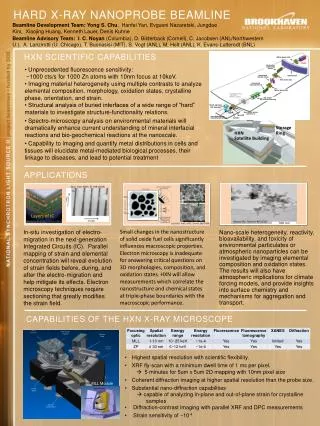
Correlating The WFC and the IBIS hard X-ray survey. F. Capitanio 1 , A. J. Bird 2 , A. Bazzano 1 and P. Ubertini 1. 1) IASF-Roma INAF, Rome, Italy 2) School of Physics and Astronomy, University of Southampton, Southampton, UK. Beppo SAX. BeppoSAX was an Italian-Dutch X-ray satellite.

E N D
Correlating The WFC and the IBIS hard X-ray survey F. Capitanio1, A. J. Bird2, A. Bazzano1 and P. Ubertini1 1) IASF-Roma INAF, Rome, Italy 2) School of Physics and Astronomy, University of Southampton, Southampton, UK
Beppo SAX BeppoSAX was an Italian-Dutch X-ray satellite. It was launched in 1996 and it observed the X-ray sky for 6 years. The payload was characterised by a wide energy range (0.1-300 keV) NFI instruments co-aligned to the Z axis of the satellite: LECS (0.1-10 keV) MECS (1.3-10 keV) HPGSPC (4-120 keV) PDS (15-300 keV) Two Wide Field Cameras aligned with the Y axis of the satellite.
WFCs Observations and characteristics The two WFCs on board BeppoSAX satellite, were mounted 180 degrees away from each other and perpendicular to the pointing direction of the Narrow Field Instruments (NFI), looking at two different sky zones during any NFI pointing. In this way, during the 6 years of BeppoSAX operational life, the WFCs secondary mode observations covered all the sky, with at least one pointing (typically 100 ksec). Moreover, two times a year the WFCs observed, as the primary instrument, the galactic bulge region. The time devoted to this program corresponds to 8% of the total observing time. Twelve such campaigns were carried out amounting to a total net exposure up to 6 Msec.
We analysed all the BeppoSAX Wide Field Camera pointings available providing a mosaic of the images of all the single pointing observations and search the map for sources as has been made for the IBIS survey. Aim of the work: This work is optimised for faint persistent sources searching. Each excess found in the WFCs maps was searched also in the IBIS maps in order to better distinguish between structures of the IBIS survey mosaics and sources.
Do the same work made for IBIS also with the WFC data, using the same tools and techniques developed for the IBIS survey IBIS and WFC Common characteristics: -Coded mask -Large FOV -pointings covering most of the sky IDEA….
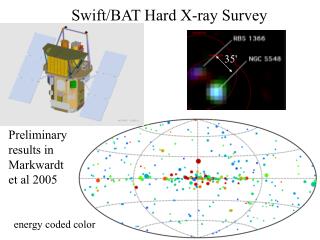
The WFC exposure map 1.5x10⁷ s 5x10⁵ s 6x10⁶ s
The IBIS exposure map 6x10⁵ s 4x10⁴ s 8x10⁶ s 3x10⁶ s
We analysed all the available OPs with the WFCs Data Analysis System, extracting the images for two energy ranges: 3-17 keV and 17-28 keV. The latter band was selected to allow a direct comparison between WFCs and IBIS. The maps: The WFC standard software uses the IROS method to extract sources from the shadowgrams of the WFC coded masks. Following the IROS procedures, we forced the software to extract a big number of sources for each OP images, effectively cleaning down into the noise. A mosaic of images, for both energy ranges, produced by IROS software, has been generated using the same software used for the IBIS survey. In this way the eventually false detections extracted by ``stressing'' the WFC software have been eliminated. The method:
Source list generation The sources position and flux were identified using a barycentering method to determine the centroid of the source profile. The mean flux of the sources was derived from the count rate at the position of the source maximum significance, using the same software developed for the IBIS survey. A second method based on SExtractor 2.4.4 softwarehas been used to cross check the results. 17-28 keV 3-17 keV Peakfind SExtractor Source list 1 Source list 2 The list of excesseswas then checked manually to eventually remove ghosts and structures
ISGRI/WFC sources correlation All the WFCs excesses were compared with the INTEGRAL lowest energy range maps, 17-30 keV and with the total lists of excesses produced for the IBIS survey. 7 possible new sources ? 167 detected also by IBIS 336 excesses 306 sources 139 detected only by WFCs 30 not firm identification
Comparison with IBIS survey Great WFC exposure of the GC region • Different class of sources • IBIS: less explored energy range • IBIS greater sensitivity WFCs: softer energy coverage
Hard sources • Transient sources • The two satellites operated in a different time period Different class of sources Soft sources Percentage of different source types detected only by WFCs and by both WFCs and IBIS.
1ES1210-646 IBIS 18-60 keV and 20-200 keV survey 3 mosaic A paper on the INTEGRAL and WFC data has been just submitted by Masetti et al. WFC 3-17 keV and 17-28 keV
Differences and similarities between our WFC catalogue and the official one. (Verrecchia et al. 2007) • The official WFC catalogue published in July 2007 by Verrecchia et al. is based on analysis of each single pointing observations. • Our work is instead based on mosaic maps searching. Official catalogue: 253 Our catalogue: 306 207 coincident sources 99 only reported in our catalogue 46 only reported in the official catalogue 15 IGR sources and 10 SWIFT sources 7 new source candidates
The case of IGR J17091-3624 In’t Zand e al. 2003
The sources reported only by our catalogue are mostly concentrated in the two sky zone at higher exposure
Work in progress: light curves production We are producing now the light curves of all the WFC catalogue sources extracting the counts from each single WFC pointing observations. 4U1630-47 ASM: 1.5-10 keV WFC: 3-17 keV
IGR J17091-3624 In’t Zand e al. 2003 1996 2001
Future applications: • Construct a combined catalogue of transient and persistent sources • study of the sources population characteristics • Long term variability studies (using combined light curves) • to use the same method with other coded mask instruments like INTEGRAL/JEM-X or SWIFT/BAT