Download
1 / 13
130 likes | 163 Views
The information and views in this report, our website & all the service we provide are believed to be relia-ble, but we do not accept any responsibility (or liability) for errors of fact or opinion. Users have the right to choose the product/s that suits them the most. Sincere efforts<br>have been made to present the right investment perspective. The information contained herein is based on analysis and up on sources that we consider reliable. This material is for personal information and based upon it & takes no responsibility. The information given<br>herein should be treated as only factor, while making investment decision. The re-port does not provide individually tailor-made investment<br>advice. 24 Carat Financial services recommends that investors independently evaluate particular investments and strategies, and encourages investors to seek the advice of a financial adviser.

E N D
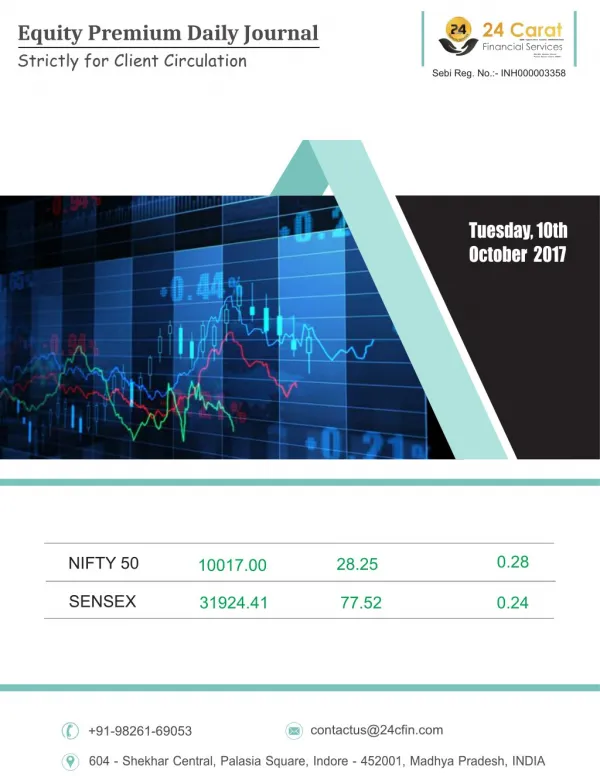
Equity Premium Daily Journal Strictly for Client Circulation Sebi Reg. No.:- INH000003358 Tuesday, 10th October 2017 0.28 NIFTY 50 28.25 10017.00 SENSEX 31924.41 77.52 0.24 contactus@24cfin.com +91-98261-69053 604 - Shekhar Central, Palasia Square, Indore - 452001, Madhya Pradesh, INDIA
Market Wrap Tuesday, 10th October 2017 Closing Commentary: Mid-caps on a hot streak In today’s trade, markets con?nued to inch higher as the broader markets outperfor med. Ni?y midcap index closed ~1% higher and managed to close at the highest point since September 21. Advance/Decline ra?o favoured bulls as market breadth remained robust. Ni?y and Bank Ni?y Index ended in green pos?ng ~0.2%/~0.3 gains. Ni?y/ Bank futures contract con?nued to add fresh open interest to the tune of ~7.97/0.71 lakh shares, mainly long posi?ons. Tracking the op?ons front, marginal hint of short unwinding was witnessed in Bank Ni?y ITM call op?ons strike as the index marched higher. Ni?y: +28points @ 10016. Bank Ni?y: +95 points @ 24347 Top 2 F&O Gainer: BIOCON, SUZLON ENERGY. Top 2 F&O Loser: SOUTH INDIAN BANK, PC JEWELLER. Most Ac?ve Index Op?on Contract: Call Op?on: 10100CE, O.I: ↑ ~2 lakh shares Put Op?on: 10000PE, O.I: ↑ ~6 lakh shares Ni?y Max O.I Strikes: 10000CE, 9800PE Bank Ni?y Max O.I Strikes: 24600CE, 24000PE (12th Oct 2017 Expiry). Buzzing Stocks ü Closing Bell: Gainers: UPL (+4%), Lupin, Airtel (+2%). Losers: Eicher, Ambuja (-1%). ü Lupin launches generic Norco tablets in the US. Stock up 2%. ü Ni?y Realty Index dips 1%. Sobha (-4%), Unitech, Oberoi Realty (-1.5%), Godrej Prop, DLF, HDIL (-1%). ü Biocon stock zooms 7% on complete response le?er for proposed biosimilar pegfilgras?m. ü Cochin Shipyard bags order worth Rs 5,400 cr from Indian Navy. Stock rallies 11%. ü South Indian Bank stock falls 6% a?er Q2 FY18 PAT declines 96% at Rs 4 Cr. Net NPA at 2.57% vs 2.54% (QoQ). ü BoB to raise Rs 1,650 Cr from bonds. Stock ends marginally up. ü Ujaas Energy gains 7% on order win from Assam Energy Development Agency. +91-98261-69053 www.24cfin.com
Market Action Tuesday, 10th October 2017 4:36 PM Indian markets close with minor gains Shares of Apex foods have hit the upper limit today for the 5th day in a row. The stock has more than doubled in value in the last 25 trading sessions 3:27 PM Apex Foods hits upper limit for 5th time Shares of Apex foods have hit the upper limit today for the 5th day in a row. The stock has more than doubled in value in the last 25 trading sessions. 12:57 PM European markets open to minor losses European markets open to minor losses; DAX & CAC down by ~0.2%. Indian markets down continue to make marginal gains; Nifty at 10014 (+14 pts). 11:04 AM Infosys sets record date for buyback Shares of Infosys have gone up by ~1%, after the Company set the record date for its buyback on 1st November. 11:02 AM Lupin gains on FDA nod for Hypertension Drug Shares of Lupin have moved up by ~2%, after the Company recieved an FDA Nod for the production of a hypertension drug. 10:58 AM Energy stocks witness drop Energy stocks have witnessed a minor drop in the opening trade; HPCL & BPCL drop by ~1%. 10:47 AM Pharma stocks move up Shares of Pharma Companies have moved up ; Lupin (+2.32%) Coal Indian (+1.49%). 10:44 AM Indian markets open to marginal gains Indian markets open to marginal gains; Nifty remains a above the 10K mark; moves up by 22 pts. +91-98261-69053 www.24cfin.com
Key Indices Tuesday, 10th October 2017 Today Index Nifty 50 Bank Nifty Nifty Next 50 Nifty 100 Nifty 200 Nifty 500 Nifty Midcap 100 Nifty Smallcap 100 % Change 28.20 (0.28%) 95.55 (0.39%) 172.45 (0.61%) 34.05 (0.33%) 21.55 (0.40%) 38.10 (0.43%) 154.40 (0.83%) 63.90 (0.81%) LTP High Low 10,016.95 24,347.45 28,391.60 10,392.00 5,450.45 8,836.40 18,678.65 7,958.35 10,034.00 24,379.75 28,430.10 10,409.00 5,458.10 8,848.60 18,702.35 7,964.30 10,002.30 24,273.65 28,302.90 10,375.40 5,439.85 8,816.55 18,567.35 7,906.55 Advance/ Decline Index Nifty 50 Nifty Next 50 Nifty 100 Nifty 200 Nifty 500 Advance 32 32 64 132 305 Decline 18 18 37 68 189 Sector Indices Today % Change Index LTP High Low Nifty Energy Nifty IT Nifty Media Nifty Pharma Nifty Auto Nifty Financial Services Nifty PSU Bank Nifty Metal Nifty FMCG Nifty Realty 13,380.20 10,726.20 3,063.25 9,530.30 11,029.85 10,019.65 3,104.20 3,721.55 25,204.85 282.50 102.35 (0.77%) 46.00 (0.43%) 11.35 (0.37%) 24.60 (0.26%) 24.05 (0.22%) 17.30 (0.17%) 3.50 (0.11%) 3.70 (0.10%) -81.50 (-0.32%) -2.45 (-0.86%) 13,417.45 10,771.95 3,073.50 9,608.90 11,065.60 10,035.80 3,118.45 3,749.50 25,339.15 286.55 13,280.45 10,712.05 3,040.75 9,506.75 11,013.75 9,992.30 3,092.05 3,691.55 25,141.10 281.90 +91-98261-69053 www.24cfin.com
Index Pullers & Draggers Tuesday, 10th October 2017 Index Draggers Index Pullers Company Name Change Company Name Change LTP Contribution Points LTP Contribution Points 843.20 12.55 (1.51%) 10.65 266.20 -4.01 -1.80 (-0.67%) Reliance Inds. ITC 935.45 11.55 (1.25%) 5.92 269.80 -3.27 Infosys ICICI Bank -1.95 (-0.72%) 1,802.70 1,802.70 7.20 (0.40%) 1,209.20 3.80 -2.07 HDFC Bank Hind. Unilever -11.05 (-0.91%) 514.55 8.60 (1.70%) 3.74 1,744.75 -2.06 Axis Bank H D F C -4.95 (-0.28%) 1,725.15 25.65 (1.51%) 3.34 321.00 -1.46 IndusInd Bank Vedanta -3.00 (-0.93%) Stocks Showing Activity Top Losers-Nifty 500 Top Gainers -Nifty 500 Company Name Change Company Name Change LTP LTP 177.85 22.95 (14.82%) 30.05 -1.95 (-6.09%) JM Financial South Ind.Bank 40.45 (10.24%) -22.55 (-4.90%) 435.55 437.45 Deepak Fert. Sobha 17.55 (9.99%) -16.80 (-4.41%) 193.15 363.85 Adani Transmissi PC Jeweller 4.95 (9.93%) -2.50 (-3.55%) Religare Enterp. Welspun India 54.80 68.00 21.70 (9.77%) -10.35 (-3.04%) Sterlite Tech. Eveready Inds. 243.90 330.65 +91-98261-69053 www.24cfin.com
52-Week High-Low Tuesday, 10th October 2017 52 Week High Today-Nifty500 52 Week Low Today-Nifty500 Company Name Change Company Name Change LTP LTP 177.85 22.95 (14.82%) 16.70 -0.15 (-0.89%) JM Financial Rel. Comm. 0.70 (4.75%) 40.45 (10.24%) 435.55 15.45 Deepak Fert. Shilpi Cable 17.55 (9.99%) 193.15 Adani Transmissi 38.65 (9.29%) HSIL 454.85 26.85 (6.90%) G N F C 415.90 Global Indices Change -2.70 -1.08 -14.97 25.44 -131.45 % Change -0.05 Indices CAC 40 DAX FTSE Shanghai Hang Seng Straits Times DOW Jones Nasdaq Nikkei Date Value Previous Close 5,359.89 12,955.94 7,522.87 3,348.94 28,458.04 3,291.29 22,775.39 6,585.36 20,628.56 09/10/2017 09/10/2017 09/10/2017 08/10/2017 08/10/2017 08/10/2017 06/10/2017 06/10/2017 05/10/2017 5,357.19 12,954.86 7,507.90 3,374.38 28,326.59 3,291.56 22,773.67 6,590.18 20,690.71 -0.01 -0.20 0.76 -0.46 0.01 -0.01 0.07 0.30 0.27 -1.72 4.82 62.15 +91-98261-69053 www.24cfin.com
Nifty Spot View Tuesday, 10th October 2017 NIFTY 10016.95 28.20 (0.28%) Oct 10, 16:00 Intraday 52 Week 10,178.95 10,013.70 10,034.00 OPEN HIGH P. CLOSE 9,988.75 10,002.30 7,893.80 LOWS 10050 R2 10032 R1 10015 Pivot 10000 S1 9985 S2 Jus?fica?on & Comments üIn Tuesday's trading session Benchmark Indices Ni?y opened on a gap up note and traded in the posi?ve territory. However, this was followed by a long consolida?on throughout the remaining part, to end the session slightly higher at 10016.95,level up 28points üAs far as index ac?vity is concerned, it was certainly a neutral day for our market as Index already opened gap up almost 24 points at 10013.70and remain sideways ?ll the end. üFor the coming session, 10035-10060 would be seen as immediate hurdles; whereas, on the lower side, any sustainable move below 9970 would result into some weakness towards 9930-9880 levels. +91-98261-69053 www.24cfin.com
Bankl Nifty Spot View Tuesday, 10th October 2017 NIFTY BANK 24347.45 95.55 (0.39%) Oct 10, 16:00 Intraday 52 Week 25,198.80 24,304.80 24,379.75 OPEN HIGH P. CLOSE 24,251.90 24,273.65 17,606.90 LOWS 24440 R2 24393 R1 24333 Pivot 24285 S1 24225 S2 Jus?fica?on & Comments üIn Tuesday’s trading session Bank Ni?y opened on a gap up note and traded with posi?ve movement & closed at level up 95.55. 24347 , üPost a consolida?on phase last week; the Ni?y Bank index gave a breakout above the resistance of 24300 in the first hour of the trade and made a high of 24379.75. However, the index lacked some momentum in second half of the market & closed above 24340. üNi?y bank Index is trading above its 21,50 & 100 days moving averages. On higher side, the index could move upto the range of 24400-24450, whereas levels around 24250 and 24150 are now supports for short-term +91-98261-69053 www.24cfin.com
“24 Carat”Call Tuesday, 10th October 2017 Range 123.30 - 126.90 52 week 73.50 - 126.90 Open 123.80 Vol. 9.90M Mkt cap 370.36B P/E Ashok Leyland Ltd (NSE:ASHOKLEY) 126.50 +2.70 (2.18%) Oct 10 - Close Currency in INR Ashok Leyland Limited is a holding company. The Company is engaged in Commercial vehicles and related components. Through its subsidiaries, it is engaged in manufacturing and trading in Medium and Heavy Commercial Vehicle, Light Commercial Vehicles, Passenger vehicles, automotive aggregates, vehicle financing and engineering design services. It offers a range of 18 to 80-seater buses under categories, such as city application and electric buses. It offers a range of trucks, which include long haul trucks, mining and construction trucks, and distribution trucks. It designs, develops and manufactures defense vehicles for armed forces. It offers Light Vehicles, which include DOST, PARTNER, STiLE and MiTR. It offers power solutions for electric power generation, agricultural harvester combines, earth moving and construction equipment, and marine and other non-automotive applications. It has operations in India, Sri Lanka, Bangladesh, Mauritius, the Middle East and Africa. 129.15 R2 127.80 R1 125.55 Pivot 124.20 S1 121.95 S2 Jus?fica?on & Comments Ashok Leyland Ltd (NSE:ASHOKLEY) Looks bullish on Daily charts ü üStock Long Term, Short Term and Intermediate Trend is up, Chart structure is posi?ve üIt is forming higher highs and higher Lows on the Daily Charts üIt has seen breakout from pennant Price Pa?en (Refer to Chart a?ached) üManaged to Close above immediate Resistance levels of 125.5 üFirmly Trading above key Moving Averages: 100 EMA, 50EMA, 21EMA üMomentum Indicator MACD Histogram Trading in Posi?ve Zone üUpsurge in the volumes has been seen with increase in prices, Also Ashok Leyland Future Open Interest was up 5.95% with increase in Price üLooking at the Chart Structure, Price ac?on, Future Data, Moving Averages, and volumes Stock looks bullish, We suggest fresh buying in the next intraday trading session. BUY ASHOKLEY @ 126- 126.5 TARGET 129/ 132 STOP LOSS 123 (QTY: 7000) +91-98261-69053 www.24cfin.com
“24 Carat”Call Tuesday, 10th October 2017 Range 341.00 - 349.00 52 week 185.57 - 349.40 Open 341.25 Vol. 1.69M Mkt cap 733.90B P/E 47.44 Motherson Sumi Systems Limited (NSE:MOTHERSUMI) 348.75 +8.90 (2.62%) Oct 10 - Close Currency in INR Motherson Sumi Systems Limited is a system solutions provider to automotive and other industries, offering services from design and prototyping to production and delivery of solutions across a range of products. The Company's segments are Automotive, which includes product categories, such as wiring harness, high tension cords, wire, plastic components, rubber components, cockpit assembly, scuff plates, thermo-formed products, mold for wiring harness components and mold parts, heating, ventilation and air conditioning (HVAC) modules, plastic molded components and brass terminals, and Non-Automotive, which includes product categories, such as wiring harness, plastic components for white goods, household wires, plates and aerobin. It also has a presence in a range of other polymer, Re-timer light device, elastomer and metal-based parts and systems. The Company caters to a range of customers in the automotive and other industries across Asia, Europe, the Americas, Australia and Africa. 353.6 R2 350.3 R1 345.6 Pivot 342.3 S1 337.6 S2 Jus?fica?on & Comments: Motherson Sumi Systems Limited ü ü Stock heading towards 52 Week High placed at 349.40 üStock Managed near immediate resistance of 347.5 üFurther upside can be seen if stock sustains above 347.5 üKey Momentum Oscillator MACDH (21, 50) entered Posi?ve zone on daily chart üStock firmly trading above Key Moving averages: 21 EMA, 50 EMA & 100 EMA on daily Chart üLooking to the technical Indicators, Moving Averages. We suggest buying the stock for next intraday trading session (NSE:MOTHERSUMI) looks bullish on Daily charts BUY MOTHERSUMI ABOVE 349.5 TARGETS 353/ 356.5 STOP LOSS 346 (QTY: 3750) +91-98261-69053 www.24cfin.com
FII And DII Activity Tuesday, 10th October 2017 Updated till 9th October 2017 FII RS CRORES Net Purchase/ Sales Date Gross Purchase Gross Sales 09-Oct-2017 06-Oct-2017 05-Oct-2017 04-Oct-2017 03-Oct-2017 Total 2882.87 3601.52 3201.46 3963.75 5770.20 19,419.80 -475.11 -1,040.40 -656.50 -632.14 -693.03 -3,497.18 3357.98 4641.92 3857.96 4595.89 6463.23 22,916.98 DII RS CRORES Net Purchase/ Sales Date Gross Purchase Gross Sales 09-Oct-2017 06-Oct-2017 05-Oct-2017 04-Oct-2017 03-Oct-2017 Total 2585.48 3978.12 2946.00 2814.19 3803.19 16,126.98 2530.06 2738.38 2426.97 2229.31 2250.78 12,175.50 55.42 1,239.74 519.03 584.88 1,552.41 3,951.48 FII And DII Activity Updated till 9th October 2017 Monthly FII Data (RS CRORES) Gross Purchase Net Purchase/ Sales Date Gross Sales September 2017 August 2017 July 2017 95,431.19 95,588.51 104,497.69 119,401.16 111,584.14 103,032.84 -23,969.97 -15,995.63 1,464.85 Monthly DII Data (RS CRORES) Gross Purchase Net Purchase/ Sales Date Gross Sales September 2017 August 2017 July 2017 +91-98261-69053 www.24cfin.com 79,160.50 70,219.04 67,911.76 79,160.50 70,219.04 67,911.76 21,025.53 16,205.22 16,205.22
Diamond Call Performance & Profit Tuesday, 10th October 2017 Our Previous Recommendation Call Date P & L Target/SL +30,000/- NIL -5,400/- +11,200/- +13,000/- +14,000/- +28,000/- NIL NIL NIL 3rd Oct-2017 3rd Oct-2017 4th Oct-2017 4th Oct-2017 5th Oct-2017 5th Oct-2017 6th Oct-2017 6th Oct-2017 9th Oct-2017 9th Oct-2017 BUY PCJWELLERS @ 348.50 - 352.50 TARGET 362.50/ 372.5 SL 340.50 (QTY: 1500) SELL STAR BELOW 845 TARGETS 830/ 810 SL 860 (QTY: 500) SELL APOLLOTYRE BELOW 237.45 TARGET 232.45/ 227.45 SL 242.45 (QTY: 3000) BUY AUROPHARMA AROUND 722- 726 TARGETS 740/ 758 SL 703.95 (QTY: 800) BUY BHARATFIN AROUND 958- 968 TARGET 983/ 997 STOPLOSS 943 (QTY: 1000) SELL STAR AROUND 865- 855 TARGETS 825/ 795 STOP LOSS 885 (QTY: 500) BUY JUSTDAIL @ 402- 404 TARGET 414.5/ 427 STOP LOSS 389.50 (QTY: 1200) BUY RELIANCE AROUND 828- 832 TARGETS 847/ 862 STOP LOSS 818 (QTY: 1000) BUY PVR @ 1370- 1380 TARGET 1420/ 1460 STOP LOSS 1340 (QTY: 400) BUY BATAINDIA AROUND 745- 750 TARGETS 770/ 785 STOP LOSS 730 (QTY: 1100) TG ACHIEVED NOT EXECUTED CLOSE @239.25 TG ACHIEVED MADE HIGH 981 CLOSED @ 837 TG ACHIEVED CLOSE @ 830 CLOSED @ COST NOT EXECUTED +91-98261-69053 www.24cfin.com
Bulls Eye’s Calls Monthly Performance Checked By:- Months Profit & Loss Rs. 2,76,900/- Rs. 90,800/-* September 2017 October 2017 November 2017 December 2017 Disclaimer 24 CARAT FINANCIAL SERVICES The information and views in this report, our website & all the service we provide are believed to be relia-ble, but we do not accept any responsibility (or liability) for errors of fact or opinion. Users have the right to choose the product/s that suits them the most. Sincere efforts have been made to present the right investment perspective. The information contained herein is based on analysis and up on sources that we consider reliable. This material is for personal information and based upon it & takes no responsibility. The information given herein should be treated as only factor, while making investment decision. The re-port does not provide individually tailor-made investment advice. 24 Carat Financial services recommends that investors independently evaluate particular investments and strategies, and ncourages investors to seek the advice of a financial adviser. 24 Carat Financial Services shall not be responsible for any transaction conducted based on the information given in this report, which is in violation of rules and regulations of NSE and BSE. The share price projections shown are not necessarily indicative of future price performance. The information herein, together with all estimates and forecasts, can change without notice. Analyst or any person related to 24 Carat financial Services might be holding positions in the stocks recommended. It is under-stood that anyone who is browsing through the site has done so at his free will and does not read any views expressed as a recommendation for which either the site or its owners or anyone can be held responsible for. Any surfing and reading of the information is the acceptance of this disclaimer. All Rights Reserved. Investment in equity & bullion market has its own risks. We, however, do not vouch for the accuracy or the completeness thereof. we are not responsible for any loss incurred whatsoever for any financial profits or loss which may arise from the recommendations above 24 Carat Financial Services does not purport to be an invitation or an offer to buy or sell any financial instrument. Our Clients (Paid Or Unpaid), Any third party or anyone else have no rights to forward or share our calls or SMS or Report or Any Information Provided by us to/with anyone which is received directly or indirectly by them. If found so then Serious Legal Actions can be taken. Team : Designation Name Email (Technical Research Analyst-Head) 24cfin.research@gmail.com Mr. Prateek Gupta (Sr. Derivative & Technical Analyst) 24cfin.lakhan@gmail.com Mr. Lakhan Patidar (Commodity Research Analyst) 24cfin.mcx@gmail.com Mr. Dharmendra Saloniya (Trainee Research Analyst) 24cfin.neha@gmail.com Mrs. Neha Baraskar (Sr. Graphic Designer) 24cfin.reports@gmail.com Mr. Shubham Chinwar +91-98261-69053 www.24cfin.com