Download
1 / 7
70 likes | 92 Views
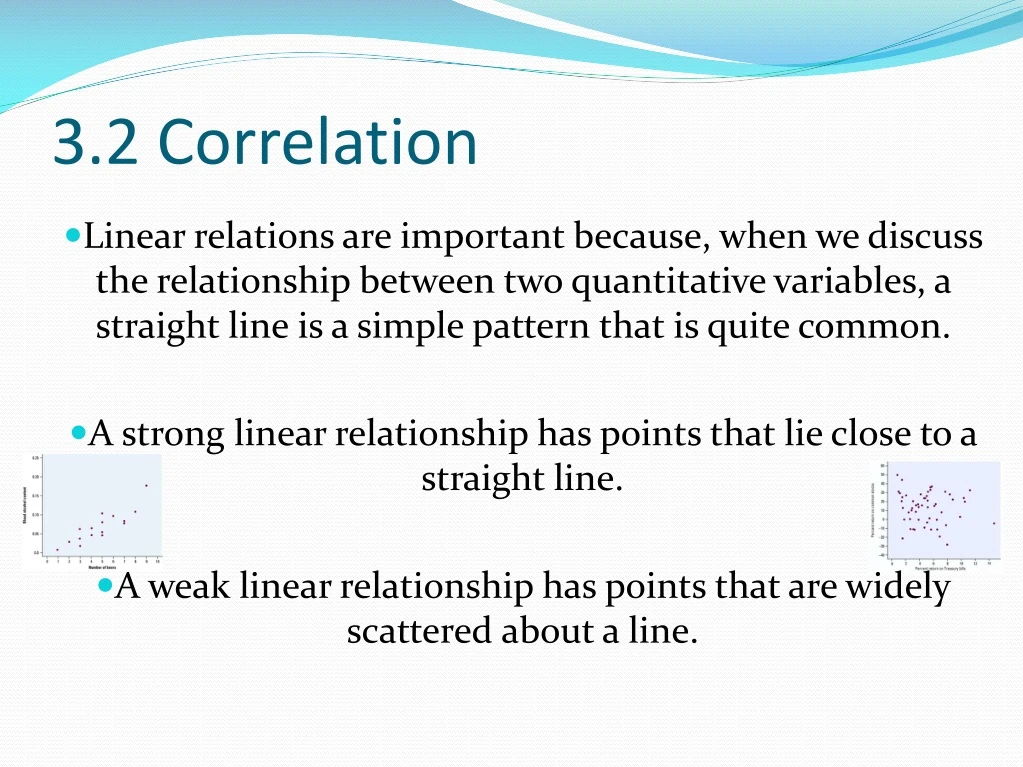
Linear relations are important because, when we discuss the relationship between two quantitative variables, a straight line is a simple pattern that is quite common. A strong linear relationship has points that lie close to a straight line.

E N D
Linear relations are important because, when we discuss the relationship between two quantitative variables, a straight line is a simple pattern that is quite common. A strong linear relationship has points that lie close to a straight line. A weak linear relationship has points that are widely scattered about a line. 3.2 Correlation
Our eyes are not good measures of how strong a linear relationship is... • A numerical measure along with a graph gives the linear association an exact value.
In words, standardize each value, multiply corresponding standardized values, add them together, and divide by n-1
Let’s calculate r! The paper “A Cross-National Relationship Between Sugar Consumption and Major Depression?” (Depression and Anxiety [2002]:118 – 120) concluded that there was a correlation between refined sugar consumption (calories per person per day) and annual rate of major depression (cases per 100 people) based on data from 6 countries. The following data were read from a graph that appeared in the paper: Compute the correlation coefficient for this data set. Is the correlation positive or negative? Weak, moderate or strong?
Facts about Correlation • Correlation makes no distinction between explanatory and response variables. • Correlation requires that both variables be quantitative. • r doesn't change when we change the units of measurement of x, y, or both. • r is positive when the association is positive and is negative when the association is negative. • The correlation r is always a number between -1 and 1. Values of r near 0 indicate a very weak linear relationship. The strength of the linear relationship increases as r moves away from 0 toward either -1 or 1. • Correlation measures strength of linear relationships only. • Like mean and standard deviation, the correlation is not resistant. • Correlation is not a complete summary of two-variable data. You should give the means and standard deviations of both x and y along with the correlation.
Patterns closer to a straight line have correlations closer to 1 or -1