Download
1 / 20
200 likes | 325 Views
This paper presents a comprehensive framework for sophisticated detection in distributed triggering systems. It explores the limitations of traditional monitoring methods in large-scale networks and introduces an innovative approach that engages local monitors for filtering, aiming to trigger alerts without overwhelming a central data coordinator. By outlining examples of potential applications, such as detecting botnet activity and network-wide anomalies, we delve into how this framework can monitor system-wide properties effectively. The focus is on achieving accurate detection while minimizing communication overhead, resulting in improved scalability for enterprise environments.

E N D
Toward Sophisticated Detection With Distributed Triggers Ling Huang* Minos Garofalakis§ Joe Hellerstein* Anthony Joseph* Nina Taft§ *UC Berkeley §Intel Research
Outline • What is a distributed triggering system? • Simple Example: State of the Art • Problem Statement • Sophisticated Example: Tomorrow • General Framework
Monitor 2 Monitor 1 Monitor 3 Traditional Distributed Monitoring • Large-scale network monitoring systems • Distributed and collaborative monitoring boxes • Continuously generating time series data • Existing research focuses on data streaming • All data sent to data fusion center • Well suited forone-time queries, trend analysis, and continuously recording system state Data Fusion Center
Distributed Triggering System • Use distributed monitoring system as infrastructure, but add: • Goal: • monitor system-wide properties (defined across multiple machines), continuously • and fire alerts when system-wide characteristic exceeds acceptable threshold. • ANDavoid pushing all the data to coordinator • Idea: do system-wide anomaly detection with a limited view of the monitored data • Approach: • Engage local monitors to do filtering (“triggering”) to avoid streaming all the data to coordinator.
Fire Not fire Example • Botnet scenario: ensemble of machines create huge number of connections to a server. Individually each attacker’s # connections lies below Host-IDS threshold. • Individual monitors: track number of TCP connections. • Coordinator tracks: SUM of TCP connections across all machines. • Flag a violation when bypass acceptable threshold Cand error tolerance e SUM (aggregate time series) time
Streaming vs. Triggering • Streaming protocols • Goal: to estimate system state or signals • Needs to keep data streaming in • incurs ongoing communication overhead • e-guarantee on signal estimation • Triggering protocols • Goal: is detection.0-1 system state • Only need detailed data when close to detection threshold. • incur overhead when necessary • e-guarantee on ability to detection
user inputs: thresholdand error tolerance aggregator Distributed Triggering Framework data1(t) original monitored time series Alarms filtered_data1(t) coordinator checkconstraint data2(t) filtered_data2(t) adjust filterparameters datan(t) filtered_datan(t)
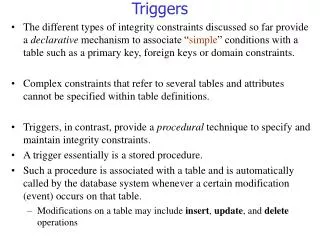
Problem Statements • What kinds of queries can you ask? • What kinds of system-wide properties can be tracked? • How do you do the filtering at the monitors? • What do we send to coordinator? Summarized data? Sampled data? • What kind of detection accuracy can we guarantee? • Coordinator may make errors with partial data
Why do detection with less data? • Scalability !!! • Enterprise networks are not overprovisioned • Sensor networks clearly have limited communications bandwidth • ISP’s today are overprovisioned – so do they need this? Yes. • Current monitoring (e.g., SNMP) happens on 5 minute time scale. What happens if this goes to 1 second time scale, or less –> data explosion. • NIDS going to smaller time scales
Where we are today • Problem: in order to track SUMs for detection, how do we compute the filtering parameters, with proof of analytical bound on detection error. • For this query type (SUM, AVERAGE) problem is solved. • Huang, et. al. Intel Tech Report April 06 • Keralapura, et. al. in SIGMOD 2006 • For other queries (applications), basic problem has to be resolved (how to filter and derive bounds)
Extensions to sophisticated triggers • PCA-based anomaly detection[Lakhina, et. al. sigcomm 04/05] • Example of dependencies across monitors • Constraints defined over time to catch persistent/ongoing violations • Time window: Instantaneous, fixed and time-varying • Compare groups of machines: is one set of servers more heavily loaded than another set? Load(Set-A) > Load(Set-B)?
H1 H2 Detection of Network-wide Anomalies • A volume anomaly is a sudden change in an Origin-Destination flow (i.e., point to point traffic) • Given link traffic measurements, diagnose the volume anomalies in flows Regional network 1 Regional network 2
Normal trafficvector abnormal trafficvector Traffic vector The Subspace Method • Principal Components Analysis (PCA): An approach to separate normal from anomalous traffic • Normal Subspace : space spanned by the first k principal components • Anomalous Subspace : space spanned by the remaining principal components • Then, decompose traffic on all links by projecting onto and to obtain:
m Eigen values Eigen vectors n The Centralized Algorithm [lakhina04] • Data matrix Y 1) Each link produces a column of data over time. 2) n links produces a row data y at each time instance. The detection is: Operation center
modified constraint Difference? Approximate Detection Procedure PCA on filtered_data(t) original constraint data(t) 12 45 9 Y= 7 63 PCA on Y 24 31 72
Intuition on how filtering is done • Slack: D captures how “far away from threshold” • Partition D into di for each monitor • Compute marginal impact of monitor i on global aggregate • Monitors send data whenever: drift based on ‘slack’in system marginal impact on others
Performance error tolerance = upper bound on error Data Used: Abilene traffic matrix, 2 weeks, 41 links.
Capabilities and Future Work • Future Work: Analysis for upper bounds on guarantees
Take Aways • For one application, we implemented a large scale detection system, using 70-80% LESS data that current streaming solution. • You don’t need all the data! • Can preserve accuracy • This is good news for scalability: more monitors, smaller time scales. • Approach is applicable to many application domains
Thank You Questions ?